Cardano Stabilizes Above $0.37 But Risks A Possible Crash
Updated: Jun 30, 2024 at 21:29

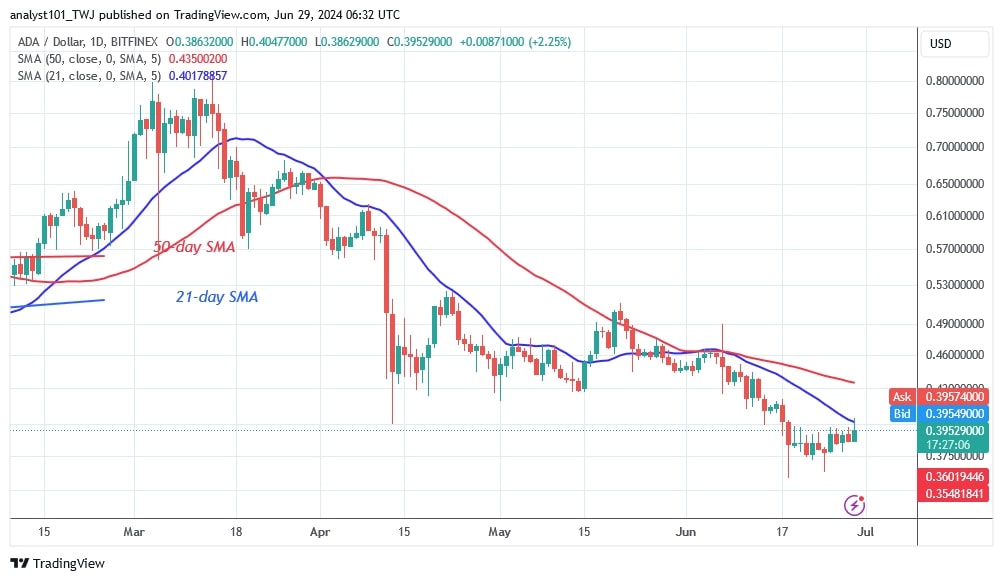
Cardano (ADA) fell further to a low of $0.35 on June 18, but the bulls bought the dips. Support has remained stable over the past week.
Long-term forecast for the Cardano price: bearish
The current situation suggests that the ADA price is trading between the $0.35 support and the resistance at the 21-day SMA or the $0.40 high. The price of the cryptocurrency has corrected upwards but is being held back by the 21-day SMA.
If the price breaks the moving average lines to the upside, Cardano will rise into the bullish trend zone. The bullish momentum will continue to the highs of $0.48 and $0.52. However, if the bullish scenario is rejected, ADA will fall or continue its move below the resistance level. Cardano will also fall to a low of $0.29 if it loses its support. At the time of writing, Cardano is trading at $0.38.
Analysis of Cardano indicators
Cardano is in an upward correction, but the 21-day SMA is hindering the positive trend. The ADA price bars are stabilizing below the 21-day SMA. Continued consolidation is likely to lead to a rebound or a breakdown.
Technical indicators
Key resistance zones: $0.80, $0.85 and $0.90
Key support zones: $0.50, $0.45 and $0.40

What is the next move for Cardano?
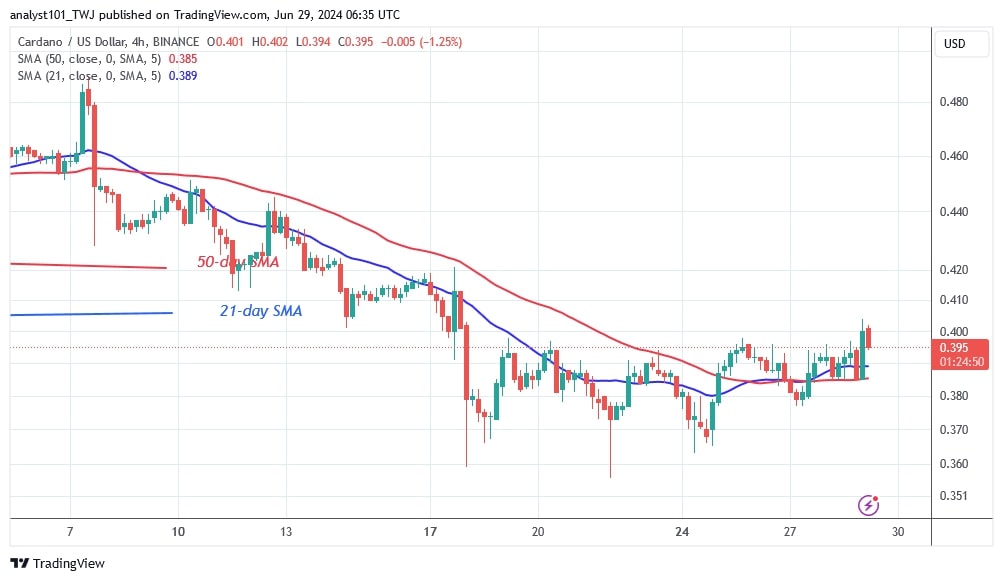
The 4-hour chart of Cardano shows a sideways trend between $0.37 and $0.40. The price bars are above the moving average lines, indicating a potential rise for the cryptocurrency. The price is now being held back by resistance at $0.40. Cardano will rise once the initial barrier is broken.

Disclaimer. This analysis and forecast are the personal opinions of the author. They are not a recommendation to buy or sell cryptocurrency and should not be viewed as an endorsement by CoinIdol.com. Readers should do their research before investing in funds.
Price
News
Price
Price
Price

(0 comments)