Cardano Moves In A Range And Encounters Resistance At $0.80

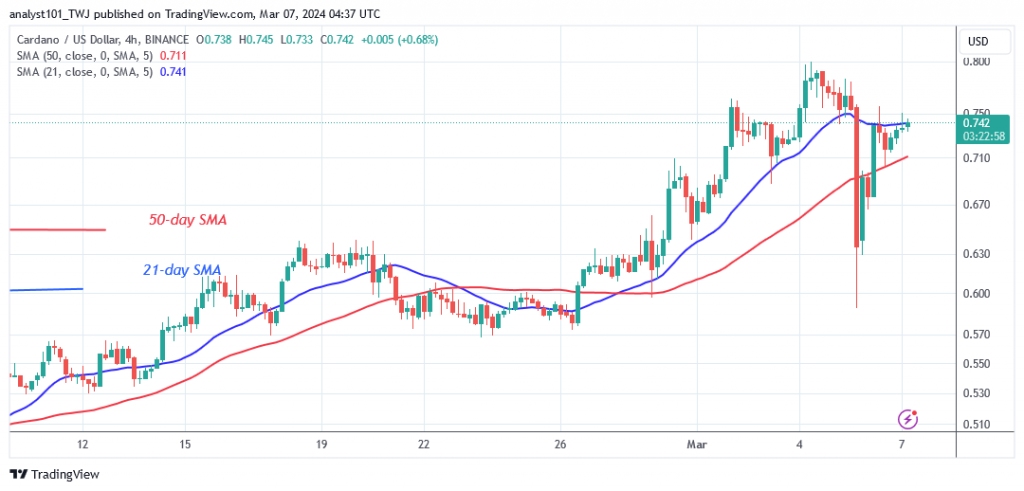
The moving average lines and the price range of $0.70 to $0.74 are the current trading ranges for the altcoin.
Long-term forecast for the Cardano price: bullish
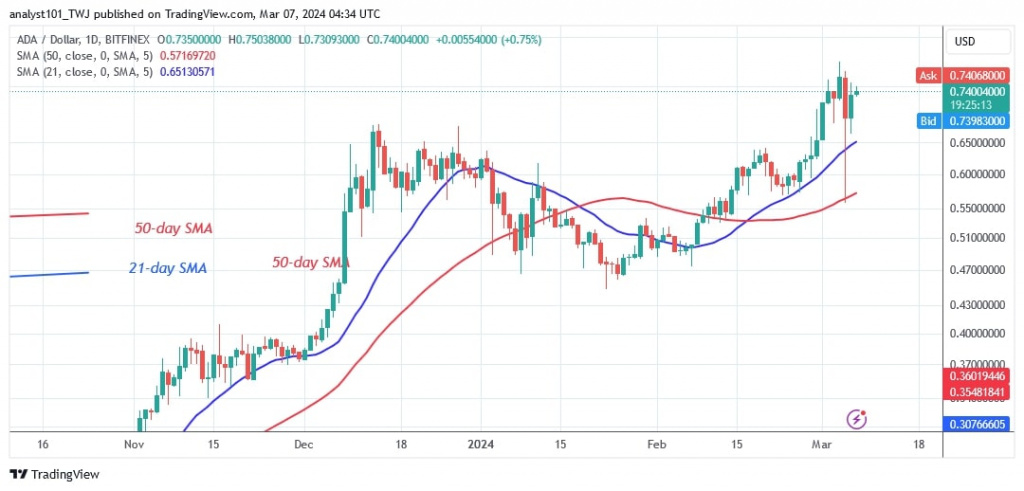
The current uptrend of Cardano (ADA) was halted at a high of $0.80 on March 4. The altcoin quickly fell below the moving average lines but above the 50-day $MA and reached support at $0.55. The bulls quickly bought the dips as it corrected above the moving average lines. The pullback signals a continued uptrend for the cryptocurrency. At the time of writing, ADA is currently worth $0.72.
Currently, the upward movement has paused. Cardano will rise to a high of $1.01 if the $0.80 resistance is broken. The altcoin is trading above the moving average lines in anticipation of an uptrend.
Cardano indicator analysis
Cardano is expected to resume its uptrend when the price bars return above the moving average lines. The cryptocurrency is rising while remaining above the moving average lines. The price bars on the 4-hour chart are trapped, indicating that the altcoin will trade in a range.
Technical indicators
Key resistance zones: $0.50, $0.55, $0.60
Key support zones: $0.30, $0.25, $0.20

What is the next move for Cardano?
On the 4-hour chart, the altcoin is in a downtrend but is between the moving averages. The upside is doubtful as it is capped by the 21-day SMA or resistance at $0.74.

Disclaimer. This analysis and forecast are the personal opinions of the author and are not a recommendation to buy or sell cryptocurrency and should not be viewed as an endorsement by CoinIdol.com. Readers should do their research before investing in funds.
Price
News
Price
Price
Price

(0 comments)