Cardano Hovers Above The $0.50 Support, But Risks A Drop
Updated: Feb 01, 2024 at 20:31

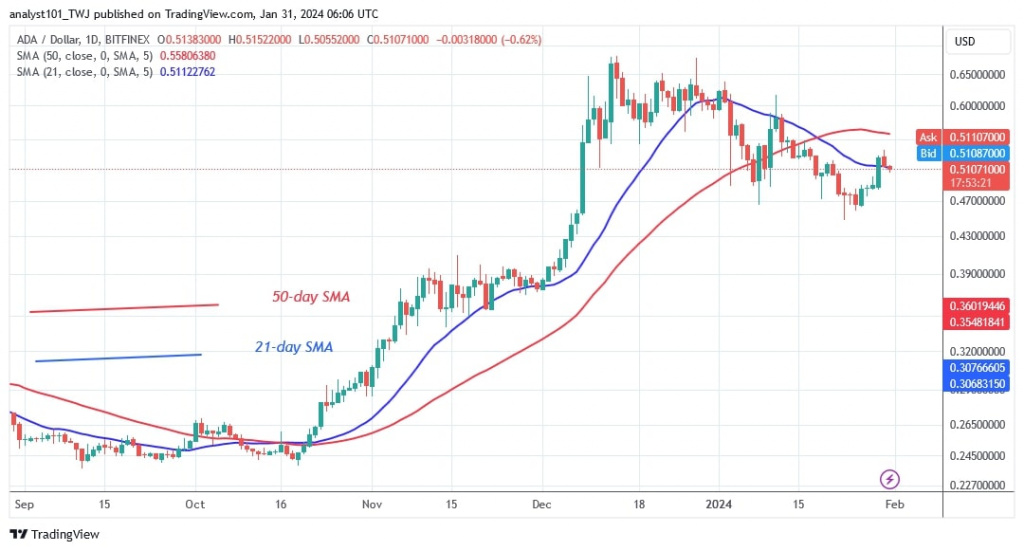
The price of Cardano (ADA) remains below the moving average lines but above the $0.48 support. ADA price analysis by Coinidol.com.
Long-term outlook for Cardano price: bearish
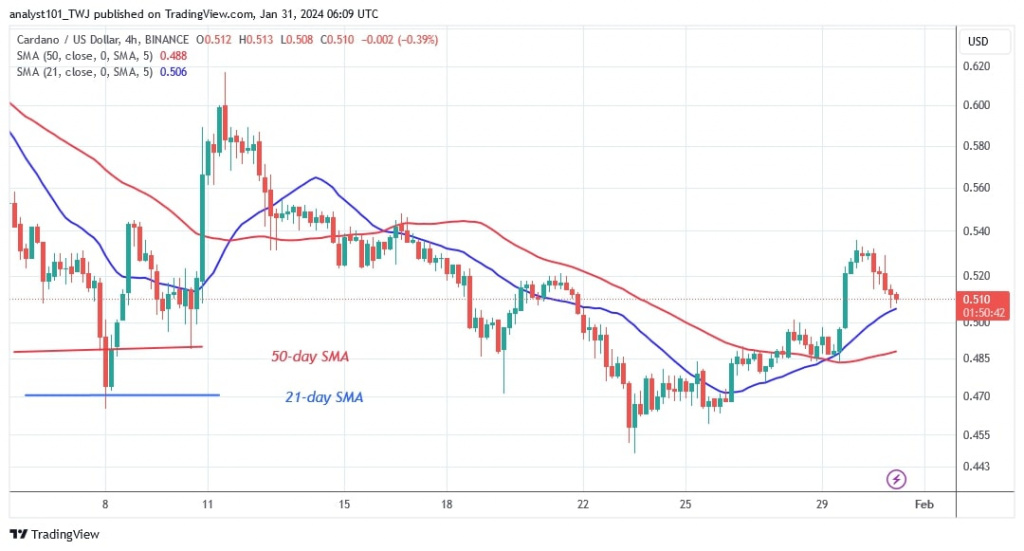
After the price drop on January 3, buyers have made desperate efforts to keep the price above the moving average lines. The moving average lines have twice rejected upward moves. The bulls broke through the 21-day SMA on January 29, 2024, but have since fallen back below it. This suggests that selling pressure is likely to return. At this point, Cardano is trading at $0.51.
Should the altcoin fall back and break through the $0.48 support level, ADA would drop to a low of $0.38.
Cardano indicator analysis
The cryptocurrency's price bar falls below the 21-day SMA, leading to a further decline. When the price bars fall below the moving average lines, selling pressure increases. The moving average lines are trending downwards, indicating a bearish crossover. This indicates a further decline in the cryptocurrency.
Technical indicators
Key resistance zones: $0.50, $0.55, $0.60
Key support zones: $0.30, $0.25, $0.20

What is the next move for Cardano?
The price of Cardano is being rejected by the moving averages. If the altcoin loses its current support level of $0.48, it will fall much more. The altcoin is currently trading above the $0.48 support but below the moving average lines. The doji candlesticks have determined the price movement of the cryptocurrency.

Disclaimer. This analysis and forecast are the personal opinions of the author and are not a recommendation to buy or sell cryptocurrency and should not be viewed as an endorsement by CoinIdol.com. Readers should do their research before investing in funds.
Price
News
Price
Price
Price

(0 comments)