Bitcoin Price Is on the Downside after Repeated Failure to Break $60,000 Overhead Resistance
Updated: Apr 05, 2021 at 11:27

Bitcoin (BTC) price analysis April 5, 2021. BTC is falling as bears attempt to break the $57,000 support. Bitcoin slumped to $56,872 low as bears broke the crucial support at $58,000.
Bitcoin (BTC) Price Long-Term Prediction: Bullish
Since March 30, Bitcoin has been trading near the $60,000 resistance zone. On April 2, buyers pushed BTC price above the overhead resistance. Unfortunately, the bullish momentum was not sustained above the resistance zone.
Bitcoin will resume an upward move if buyers can push it above the $58,000 support. Prices tend to rise above this support level to retest the $60,000 overhead resistance. However, if the bears break the $57,000 support, further selling pressure will ensue. Bitcoin will fall to $54,000 low and subsequently reach the $50,000 support. In the meantime, BTC/USD is fluctuating between $57,000 and $60,000 price levels. Meanwhile, Bitcoin is trading at $57,166.50 at the time of writing.
Bitcoin (BTC) Indicator Reading
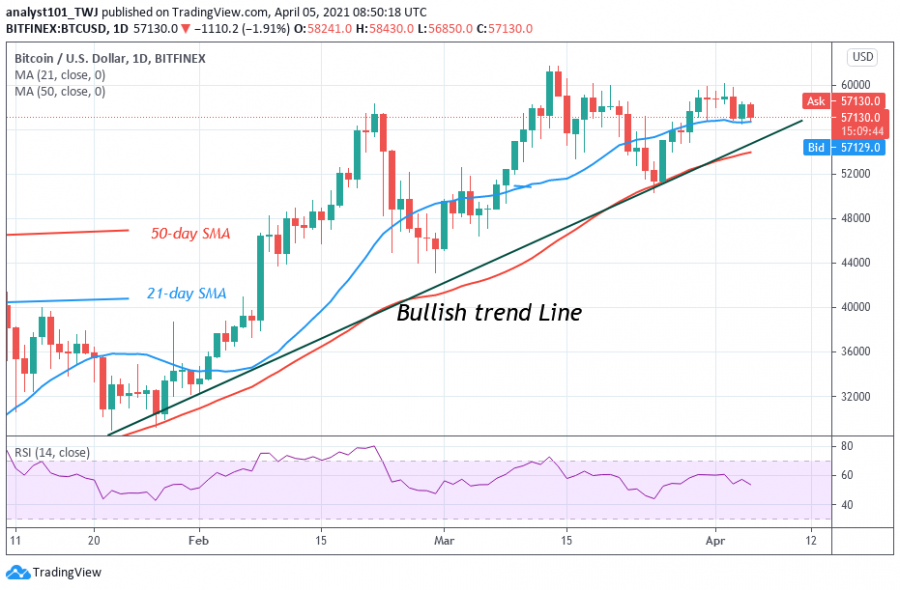
Bitcoin is at level 60 of the Relative Strength Index period 14. It indicates that the market is in the uptrend zone and above the centerline 50. The BTC price is still above the moving averages which indicate a possible rise in price.

Technical indicators:
Major Resistance Levels – $60,000 and $62,000
Major Support Levels – $45,000 and $40,000
What Is the Next Direction for BTC/USD?
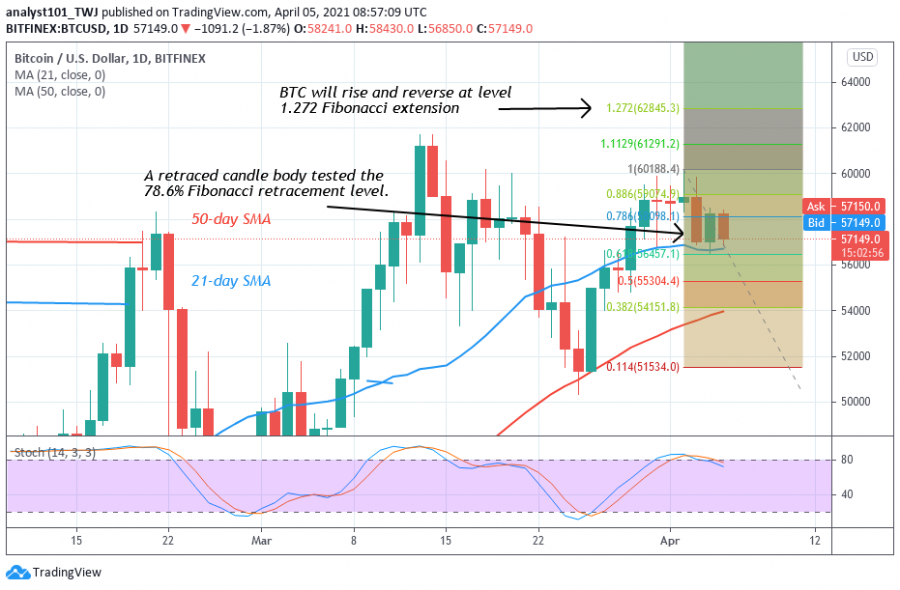
Bitcoin is fluctuating between $57,000 and $60,000 price levels. The price action has indicated small body candlesticks like Doji and Spinning tops. These candlesticks indicate that buyers and sellers are undecided about the direction of the market. On April 2 uptrend; a retraced candle body tested the 78.6% Fibonacci retracement level. This retracement indicates that Bitcoin will rise to level 1.272 Fibonacci extension and reverse. The price action is yet to reach that level.

Disclaimer. This analysis and forecast are the personal opinions of the author that are not a recommendation to buy or sell cryptocurrency and should not be viewed as an endorsement by CoinIdol. Readers should do their own research before investing funds.
Price
News
News
News
Price

(0 comments)