BNB Stabilizes Above $560, Indicating A Positive Trend

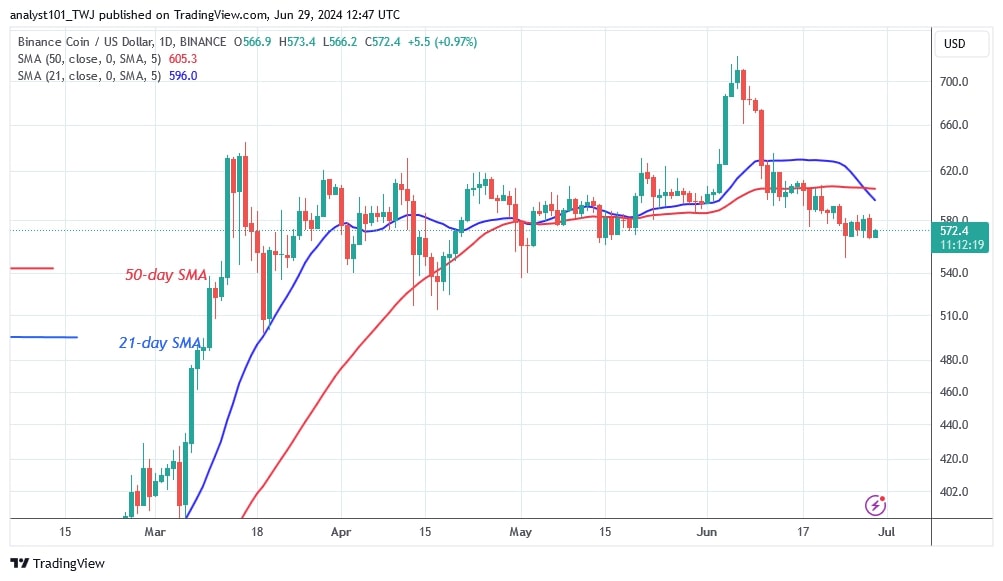
The price of the BNB (BNB) coin fell further to $551.10, although bulls took advantage of the losses.
Long-term forecast for the BNB price: bearish
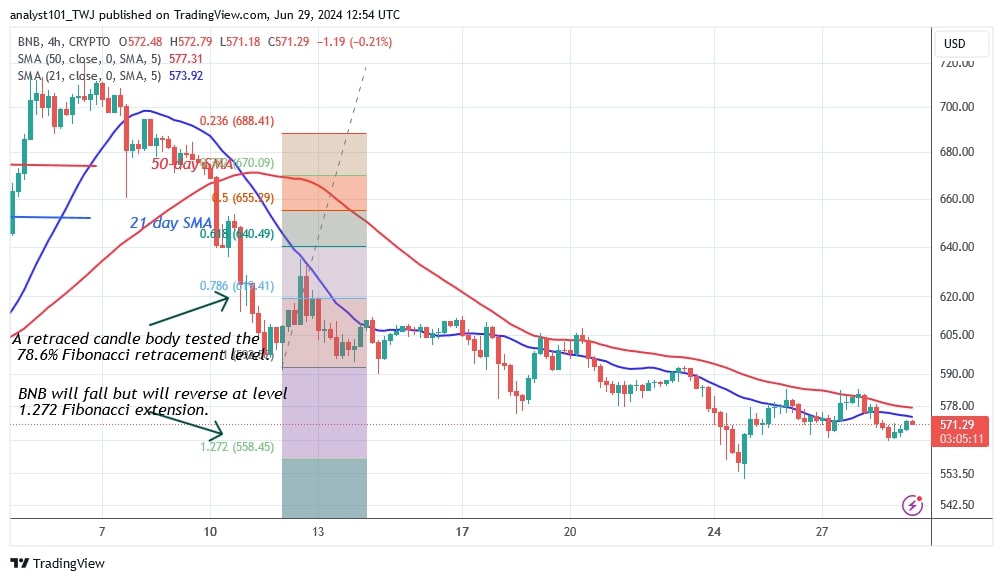
The cryptocurrency has corrected higher, although it is consolidating above the $560 support. In other words, BNB is trading above the $560 support but below the resistance at the 21-day SMA. The current selling pressure has reached bearish fatigue. However, should the bears break the $560 support, the altcoin would drop to its previous low of $536.
On the upside, BNB will resume its positive trend if buyers keep the price above the moving average lines. Currently, BNB is valued at $572.
BNB indicator reading
On the 4-hour chart, BNB is bearish with the price bars moving down and below the moving average lines. The moving average lines are limiting an upward price movement. Doji candlesticks dictate the price movement.
Technical indicators:
Key resistance levels – $600, $650, $700
Key support levels – $400, $350, $300

What is the next direction for BNB/USD?
BNB is in a downtrend and has fallen to a low of $551. In the previous price action, BNB fell to a low of $536 before rebounding.
Today, BNB is stabilizing above the support level of $579 in anticipation of a positive trend.

Disclaimer. This analysis and forecast are the personal opinions of the author and are not a recommendation to buy or sell cryptocurrency and should not be viewed as an endorsement by CoinIdol.com. Readers should do their research before investing in funds.
Price
Blockchain
Price
Price
Price

(0 comments)