BNB Is In A Fluctuation Range And Continues To Trade Above $550

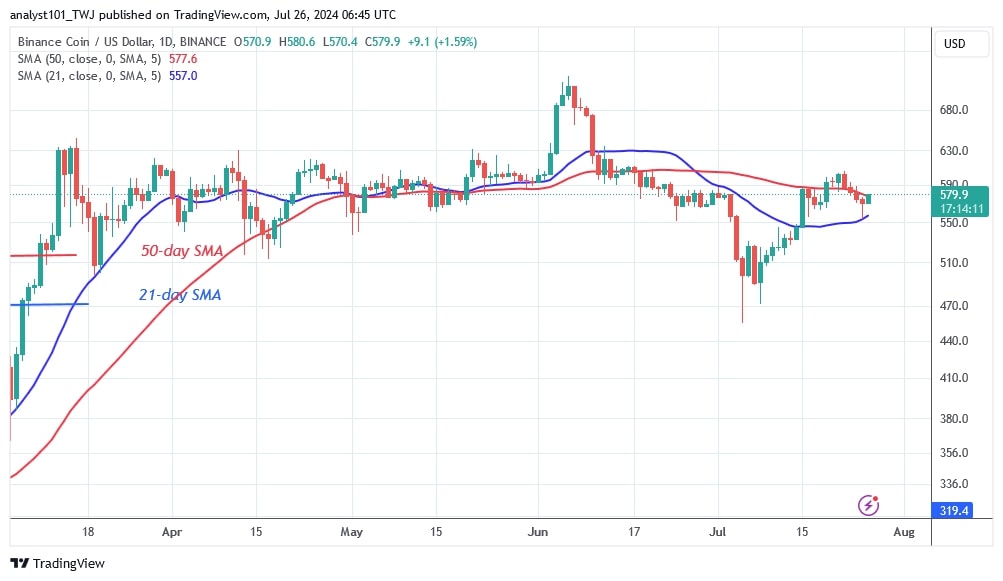
The price of Binance (BNB) coin fell and broke below the 50-day SMA support. The bearish momentum continued until it made a low above the 21-day SMA.
Long-term forecast for the BNB price: bearish
The price of the cryptocurrency is currently trapped between the moving average lines. The cryptocurrency fell as buyers were unable to sustain positive momentum above the $635 hurdle.
Bearish momentum reached the 21-day SMA support despite bulls resisting the fall. Crypto price rallied although it remains below the 50-day SMA resistance. BNB is limited to the moving average lines. Breaking either the 50-day or 21-day moving average line will determine whether prices move higher or lower. BNB is valued at $580.40 at the time of writing.
BNB indicator reading
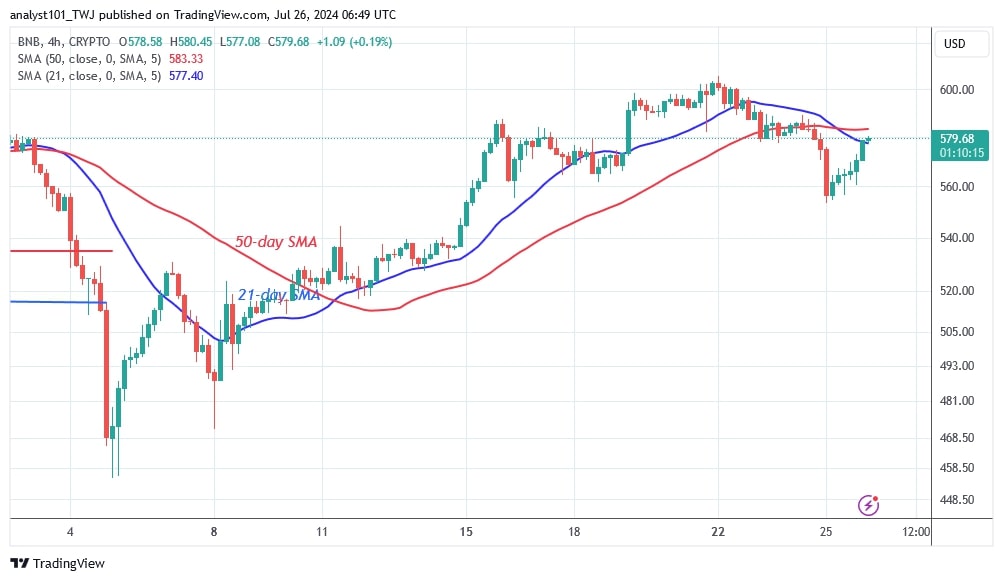
The BNB price bars have found themselves back between the moving average lines after rejecting the $635 resistance zone. On the 4-hour chart, the price bars are below the moving average lines, but the decline has paused as the altcoin resumes its uptrend. Doji candlesticks have continued to dominate the price action.
Technical indicators:
Key resistance levels – $600, $650, $700
Key support levels – $400, $350, $300

What is the next direction for BNB/USD?
BNB has fallen but remains between the moving average lines. Bulls are trying to keep the price above the 50-day SMA but remain trapped below it. The altcoin is expected to trade in a range between the moving average lines in the coming days. On the daily chart, the altcoin is trading in a narrow range, which will lead to a breakdown.

Disclaimer. This analysis and forecast are the personal opinions of the author and are not a recommendation to buy or sell cryptocurrency and should not be viewed as an endorsement by CoinIdol.com. Readers should do their research before investing in funds.
Price
News
Price
Price
Price

(0 comments)