BNB Faces Strong Resistance At The $600 Barrier
Updated: Oct 29, 2024 at 14:31

Today, bullish momentum for BNB is testing resistance at $600. Price analysis by Coinidol.com.
BNB price long term forecast: ranging
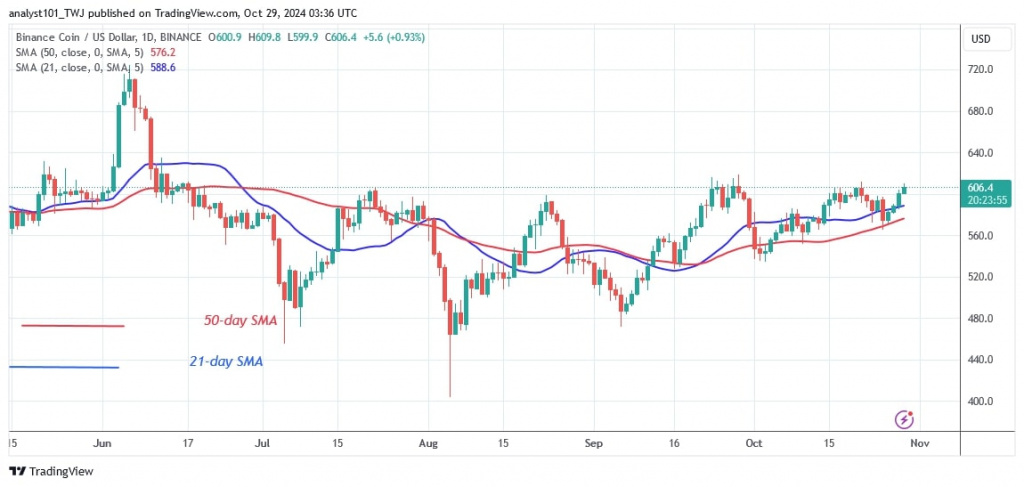
The price of Binance Chain Native Token (BNB) has remained range-bound since the September 23 price rally. The cryptocurrency has been trading above the $540 support and below the $620 barrier over the past month.
Now, if the $600 barrier is broken to the upside, the altcoin will rise to $635, the next resistance level. However, the bears will put up fierce resistance near the high of $635.
Nonetheless, the upside momentum will extend to the previous high of $724 where the bears are losing out. The price range of $540 to $620 won't change if the barrier isn't breached. The current price of BNB is $605.
BNB indicator reading
BNB is trading sideways as indicated by the horizontal moving average lines. The price bars are above the moving average lines as the altcoin retests the $600 resistance level. BNB is showing a long candle wick at the recent high. This indicates strong buying pressure at higher levels.
Technical indicators:
Key Resistance Levels – $600, $650, $700
Key Support Levels – $400, $350, $300

What is the next direction for BNB/USD?
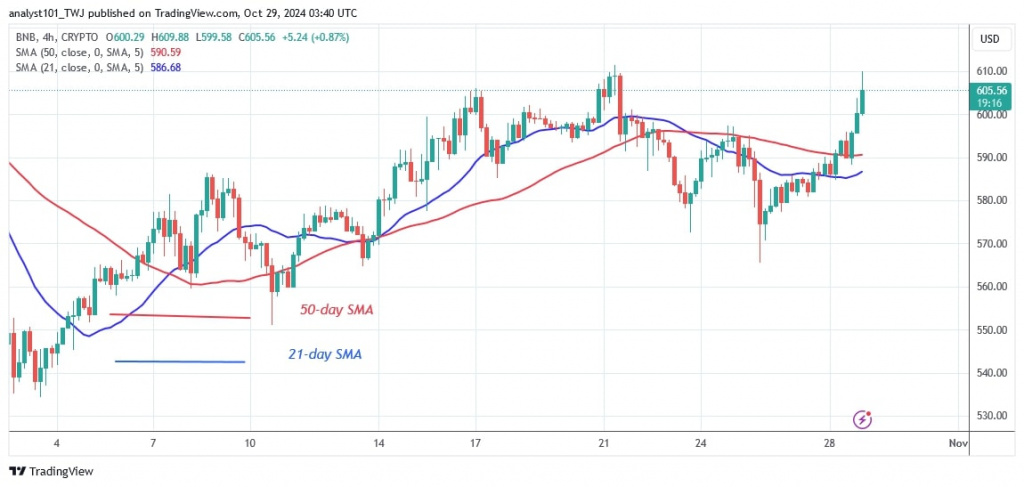
BNB is in a sideways movement below the $610 resistance level. The price of the cryptocurrency has tested the barrier level three times and declined. The extended candlestick wicks signal significant selling pressure at the $610 high. BNB has fallen above or below the moving average lines as it faces rejection at its recent high.
Disclaimer. This analysis and forecast are the personal opinions of the author. They are not a recommendation to buy or sell cryptocurrency and should not be viewed as an endorsement by CoinIdol.com. Readers should do their research before investing in funds.
Price
Price
News
News
Price


(0 comments)