BNB Remains Above $610 And Continues Its Advance
Updated: Nov 10, 2024 at 20:54

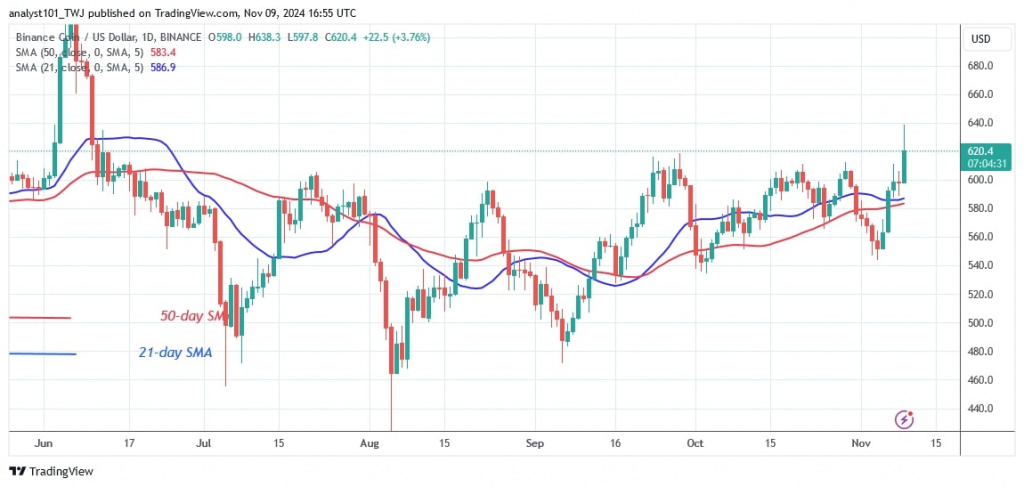
The price of Binance Chain Native Token (BNB) rose impressively, reaching a high of $638 on November 9. The bullish momentum broke out above the barriers but could not sustain above the current high.
Long-term forecast for the BNB price: bullish
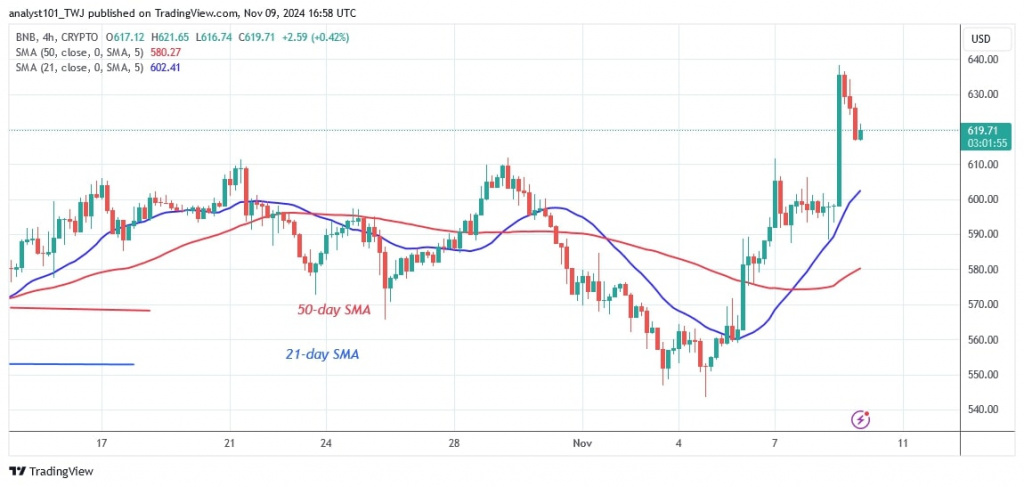
Today, the BNB price is bearish and approaching the breakout level of $610. The uptrend will resume if the altcoin rises above the $610 breakout level or the moving average lines. If the bears break below the moving average lines, BNB will return to its previous range of $540 to $620.
In the meantime, BNB has fallen but remains above the $610 breakout level. The price of the cryptocurrency stands at $616 at the time of writing.
BNB indicator reading
The moving average lines remain horizontal as the price rises above them. On November 9, a long candlestick wick indicates the resistance level. The extended candlestick wick signals strong selling pressure at the higher price point. Doji candlesticks mark the price activity.
Technical indicators:
Resistance Levels – $600, $650, $700
Support Levels – $400, $350, $300

What's next for BNB/USD?
BNB is in an uptrend and has risen to a high of $638. The latest high marks the end of the uptrend. The price of the cryptocurrency falls as it approaches the breakout level and then stalls above this level. BNB will return to its previous price range if it loses support from the breakout level or the 21-day SMA.

Disclaimer. This analysis and forecast are the personal opinions of the author. They are not a recommendation to buy or sell cryptocurrency and should not be viewed as an endorsement by CoinIdol.com. Readers should do their research before investing in funds.
News
Price
News
Price
Price

(0 comments)