BNB Is Breaking Down And Approaching The $540 Price Area
Updated: Nov 02, 2024 at 13:02

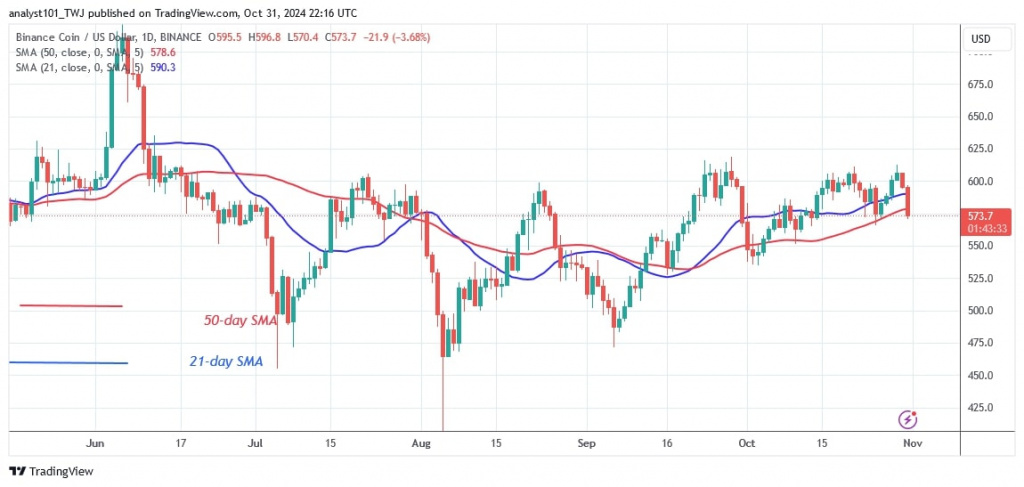
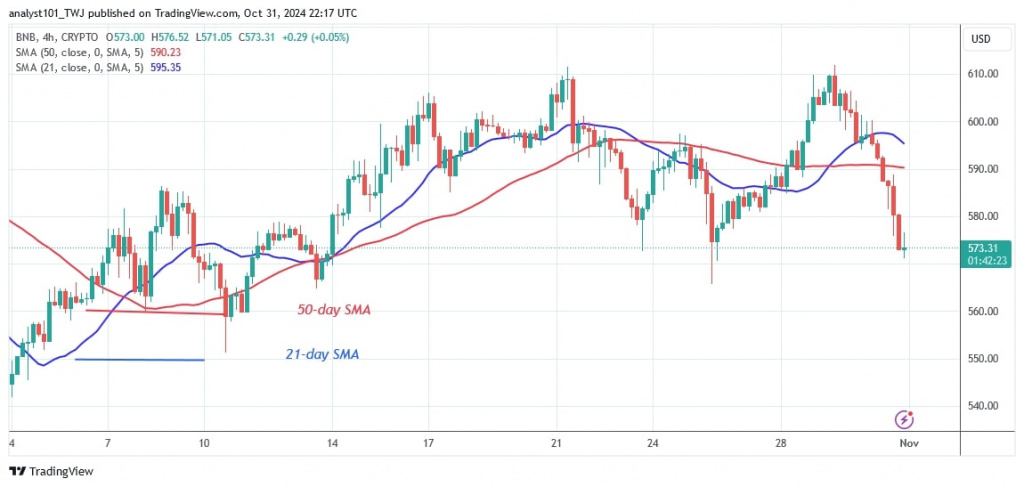
The price of Binance Chain Native Token (BNB0 has fallen below the moving average lines after being rejected at the high of $612.50 on October 31. The cryptocurrency fell to a low of $570 before recovering.
BNB price long term forecast: ranging
Furthermore, the current price action suggests that BNB is trading within a limited range of $540 to $620. If the price falls into the lower price range, the bulls will buy the dips and resume the sideways trend. The bulls are defending the current support level of $540. Today, the uptrend could continue but the altcoin will be rejected at the moving average lines.
In recent prices, rising movements have been slowed by resistance near $600. Meanwhile, the altcoin is trading below the moving averages, indicating an uptrend. BNB is currently worth $575.
BNB indicator analysis
On October 31, BNB's price bars fell below the moving average lines. The bulls are defending the $540 support and limiting the altcoin's further decline. The price bars are below the moving average lines, indicating a further decline for the cryptocurrency.
Technical indicators:
Resistance Levels – $600, $650, $700
Support Levels – $400, $350, $300

What is the next direction for BNB/USD?
BNB will continue to trade sideways as it falls below the moving average lines. Currently, the altcoin is bearish as it reaches the lower $540 price area. However, doji candlesticks have caused price action to be gradual. A sideways trend will start if the altcoin falls above the price range.

Disclaimer. This analysis and forecast are the personal opinions of the author. They are not a recommendation to buy or sell cryptocurrency and should not be viewed as an endorsement by CoinIdol.com. Readers should do their research before investing in funds.
Price
Price
News
News
Price

(0 comments)