Bitcoin Consolidates Above $13,000, Larger Move Likely Soon

Bitcoin (BTC) price analysis, October 26. Following its recent rally to $13,200 high, Bitcoin has resumed a sideways trend.
Bitcoin Price Long-Term Prediction: Bullish
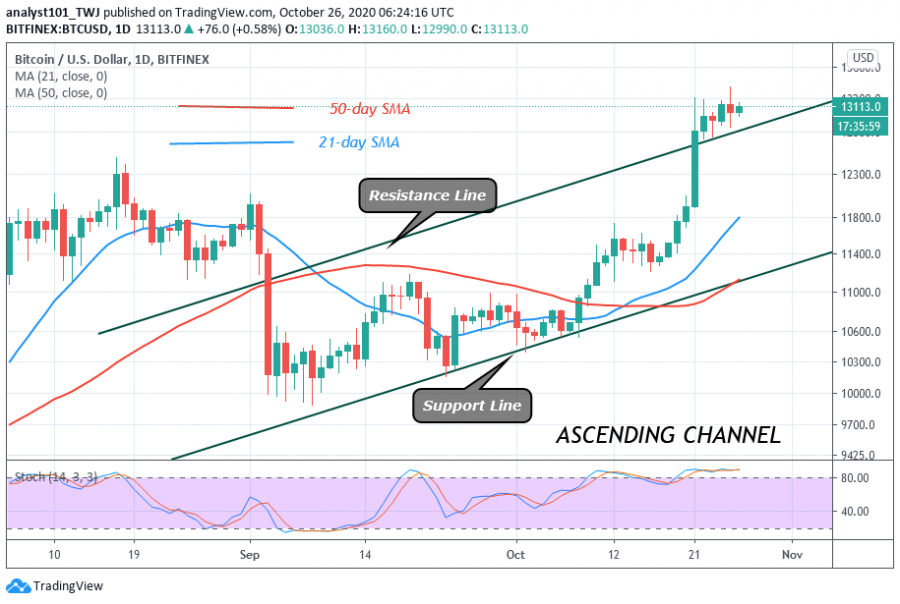
The current uptrend is facing strong rejection at the $13,200 to $13,500 resistance zones.
Consequently, the king coin has been compelled to a range-bound movement since October 21. For the past five days, the crypto had been fluctuating between $12,800 and $13,200. In the last 24 hours, buyers attempted to break the $13,200 resistance.
The bearish reaction repelled the upward move as the price fell to the range-bound zone. On the upside, if the bulls break the $13,200 and $13,500 resistances, the upside momentum will resume. Bitcoin will rally above $14,000 if the bullish scenario is met. Otherwise, the current range-bound movement will persist. Today, Bitcoin is trading at $13,091 as the price continues to retest $13,200.
Bitcoin (BTC) Indicator Reading
Bitcoin has continued to trade above the 80% range of the daily stochastic. It has been trading in the overbought region of the market since October 10. Sellers have attempted pushing prices down. Nonetheless, the uptrend will be sustained as long as the price is above the SMAs.

Key Resistance Zones: $1,000, $11,000, $12,000
Key Support Zones: $7,000, $6,000, $5,000
What Is the Next Direction for BTC/USD?
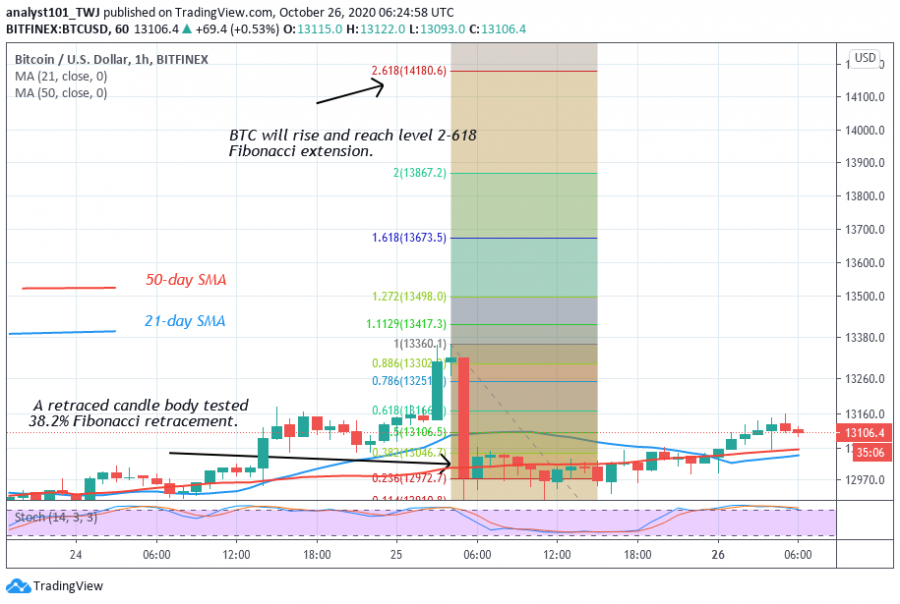
According to the Fibonacci tool analysis, there is a possibility of a further upward move. On October 22 uptrend, BTC price reached the $13,200 high but was resisted. The retraced large candle body tested the 38.2% Fibonacci retracement level. With this retracement, BTC will rise and reach level 2.618 Fibonacci extension level. That is the coin will reach a high of $14,180.60.

Disclaimer. This analysis and forecast are the personal opinions of the author and not a recommendation to buy or sell cryptocurrency and should not be viewed as an endorsement by CoinIdol. Readers should do their own research before investing funds.
Price
Price
Price
Price
Price

(0 comments)