Bitcoin Loses $58,000 Crucial Support, Further Decline to $54,000 Likely

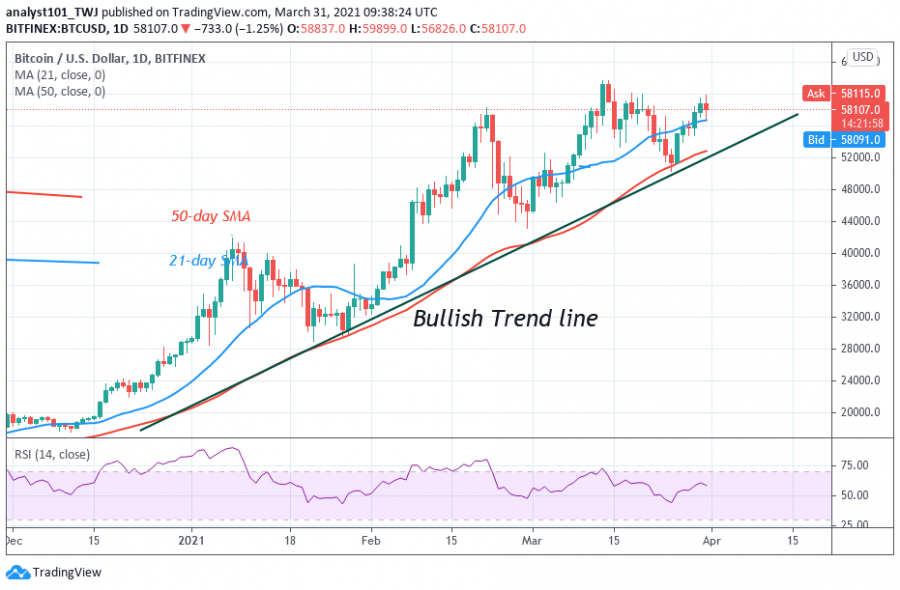
Bitcoin plunged to $56,800 low after retesting the $60,000 resistance level twice. In the first retest at the resistance, the market slumped to $58,400 support and resumed a sideways trend.
In the second retest, BTC price reached a high of $59,898 but was repelled as price reached the low of $56,826. Bitcoin faced severe selling pressure as buyers struggle to sustain the price level above the $58,000 support.
Following the breakdown on March 31, the bulls buy the dips as price moves up to $58,250. However, the selling pressure pushed BTC/USD further downward. Today, BTC price has fallen below the $58,000 crucial support. On the downside, the market will decline to $54,000 low which is the next major support level. However, if the bears break the $54,000 support, Bitcoin will fall to $48,000 low. In other words, Bitcoin will fall into a deeper correction.
Bitcoin indicator reading
Bitcoin is at level 60 of the Relative Strength Index period 14. It indicates that the market is in the uptrend zone and above the centerline 50. The BTC price is still above the moving averages which indicate a possible rise in price.

Technical indicators:
Major Resistance Levels – $60,000 and $62,000
Major Support Levels – $45,000 and $40,000
What is the next direction for BTC/USD?
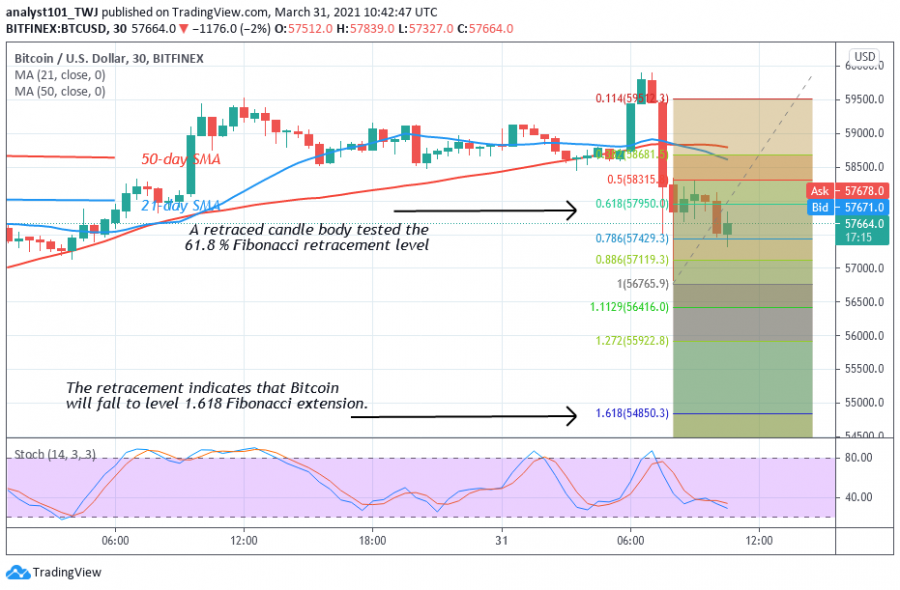
BTC/USD is in a downward move as bulls fail to break the $60,000 psychological price level. Meanwhile, on March 31 downtrend; a retraced candle body tested the 61.8 Fibonacci retracement level. The retracement indicates that the market will fall to level 1.618 Fibonacci extensions. That is the low of $54,850.30.

Disclaimer. This analysis and forecast are the personal opinions of the author that are not a recommendation to buy or sell cryptocurrency and should not be viewed as an endorsement by CoinIdol. Readers should do their own research before investing funds.
Price
Coin expert
Price
Price
Price

(0 comments)