Bitcoin Cash in a Sideways Move, May Revisit Resistance at $773
Updated: Feb 19, 2021 at 14:49

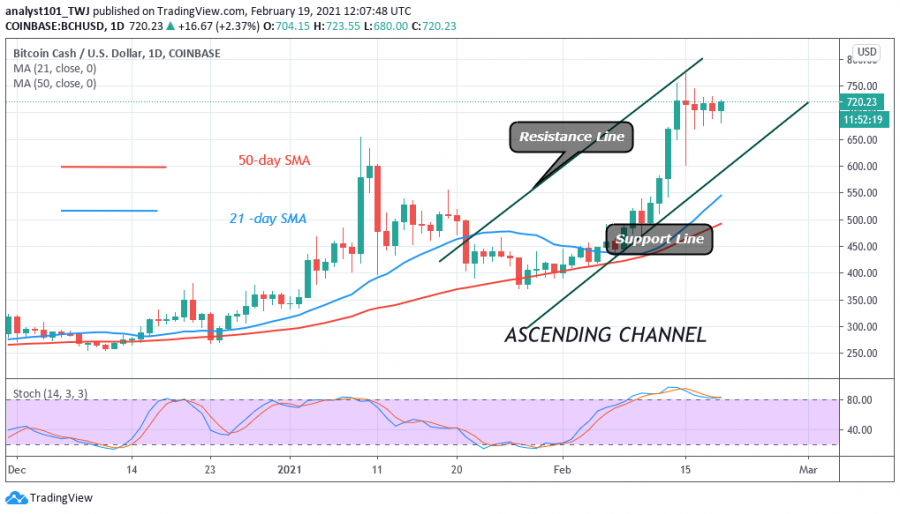
On February 15, buyers were able to push BCH to $773 high. Soon after reaching the recent high, the cryptocurrency fell and went into a range-bound movement. It fell to a low of $680 but the price corrected up to $740 high. In other words, for the past week, BCH has been fluctuating between $680 and $740.
Today, the market has risen to $725 at the time of writing. Bitcoin Cash is trading in the bullish trend zone. The chances of a further upward move are likely. If the price breaks the $740 resistance, there is a likelihood of retesting the $773 overhead resistance. The altcoin will resume a fresh uptrend to $900 high
Bitcoin Cash indicator reading
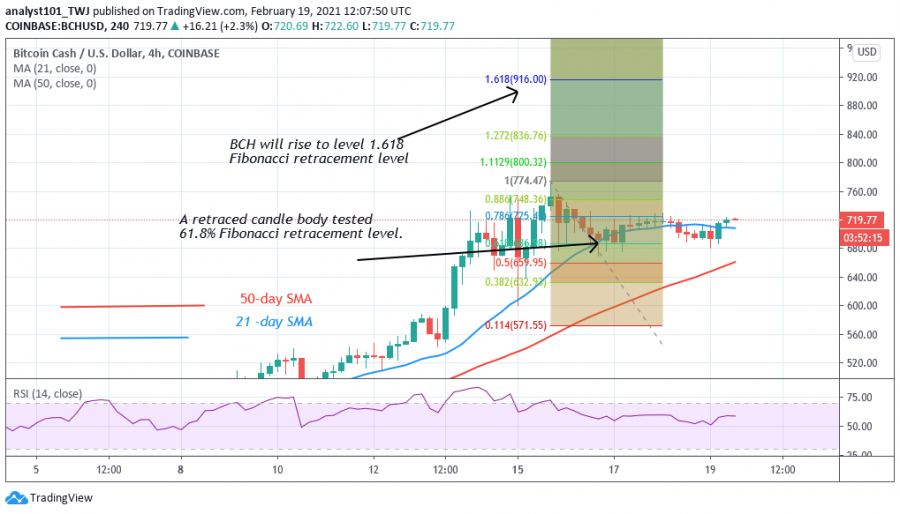
BCH price is above the 80% range of the daily stochastic. It indicates the price has reached the overbought region of the market. Sellers may emerge to push prices down. The cryptocurrency is at level 65 of the Relative Strength Index period 14. It indicates that BCH is in the uptrend zone and above the centerline 50.

Key Resistance Zones: $800 and $820
Key Support Zones: $680 and $680
What is the next move for Bitcoin Cash?
BCH has fallen and resumed a range-bound movement after the recent high. A breakout will propel the price to move up. On January 15 uptrend; the retraced candle body tested the 61.8% Fibonacci retracement level. The retracement indicates that BCH is likely to rise to level 1.618 Fibonacci extension. In other words, BCH will rise to a high of $916.

Disclaimer. This analysis and forecast are the personal opinions of the author that are not a recommendation to buy or sell cryptocurrency and should not be viewed as an endorsement by Coin Idol. Readers should do their own research before investing funds.
News
Coin expert
Politics
Price
Price

(0 comments)