Bitcoin Cash Support at $200 Becomes Vulnerable as Price Retests $220 High
Updated: Oct 03, 2020 at 10:59

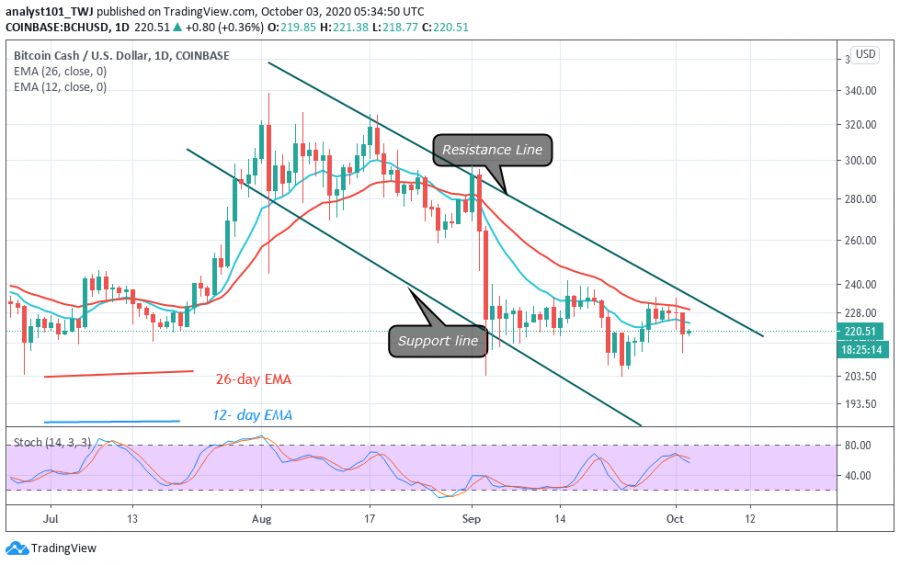
Bitcoin Cash recent rallies have been nullified as bulls were repelled at the $232 price level. However, buyers were unable to push prices above the recent high.
If BCH has risen above $240, the upside momentum would have resumed. Buyers made two attempts to push price above $232 high before it plunges to $212 low.
Besides, the selling pressure will continue to the critical support at $200 as price makes a retest at $220 high. It is uncertain if the support at $200 will be breached. If it is broken the downtrend will resume to the low at $140. Perhaps, this will be the first breakdown at this level since March. Conversely, if the critical support holds, the recent price movement is likely to resume an upward move.
Bitcoin Cash indicator reading
The price bars are below the EMAs after rejection at the 26-day EMA. This suggests a further downward movement of the coin. The coin is below the 60% range of the daily stochastic. It indicates a bearish movement of the coin. The EMAs are sloping southward indicating the downtrend.

Key Resistance Zones: $440, $480, $520
Key Support Zones: $200, $160, $120
What is the next move for Bitcoin Cash?
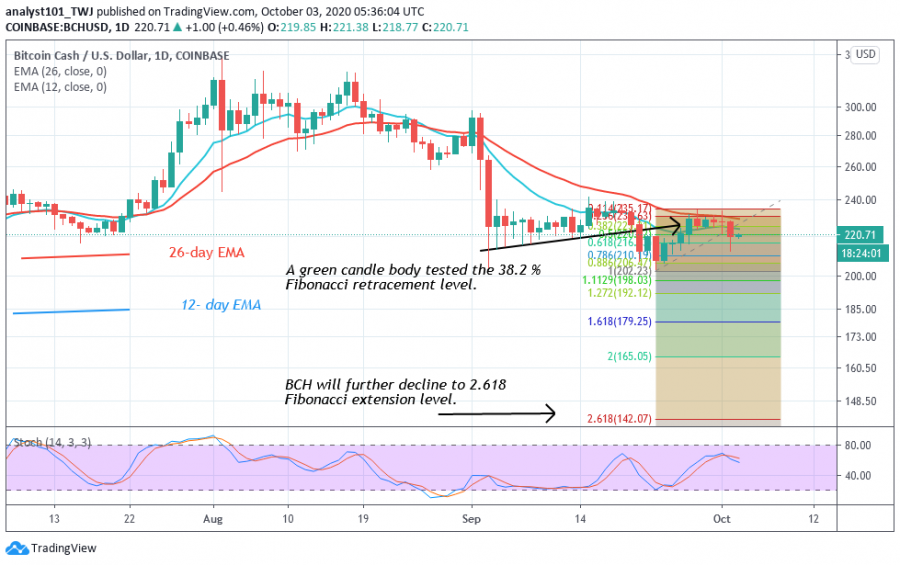
Bitcoin Cash faces rejection after one week of retesting the $232 resistance. The downward move is likely to continue if price breaks the critical support at $200. On September 23 downtrend, the last retraced candle body tested the 38.2 % Fibonacci retracement level. This explains that the coin will decline to 2.618 Fibonacci extension level or a low of $142.07.

Disclaimer. This analysis and forecast are the personal opinions of the author that are not a recommendation to buy or sell cryptocurrency and should not be viewed as an endorsement by Coin Idol. Readers should do their own research before investing funds.
Price
Price
Price
Price
News

(0 comments)