Bitcoin Cash Loses $250 Support, May Decline to $222 Low

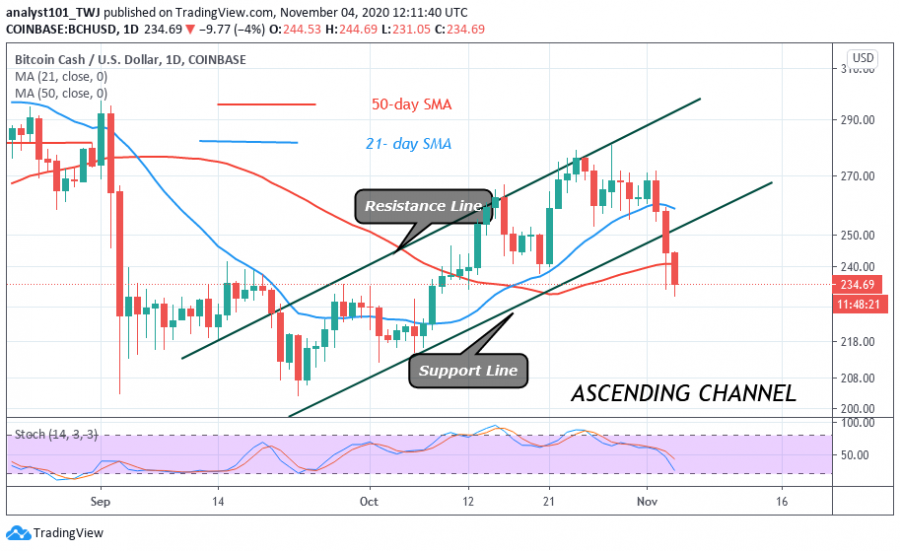
Yesterday, buyers were overwhelmed as the price broke below the critical support level at $250. The coin fell to the low at $233 but corrected upward to $245 high.
The uptrend was rejected as the crypto resumed a fresh downtrend. The implication is that a further downward movement of the coin is likely.
For example, the price is testing and about to break the previous low at $233. A break below the $233 support will make the coin to decline to a $218 low. However, if buyers defend the current support at $233, the upward move will resume. Otherwise, the downtrend will prevail. Nonetheless, as I look at the chart at the time of writing, the bears are about to break the recent support. Undoubtedly, BCH will sink to $220 or $218 low.
Bitcoin Cash indicator reading
Yesterday, the bears broke the support line of the ascending channel. As price breaks and closes below the support line, it suggests that the coin will further decline. The coin is in a bearish momentum as it is below the 50% range of the daily stochastic. BCH is at level 26 of the Relative Strength Index Period 14. It implies that BCH has fallen into the oversold region of the market.

Key Resistance Zones: $440, $480, $520
Key Support Zones: $200, $160, $120
What is the next move for Bitcoin Cash?
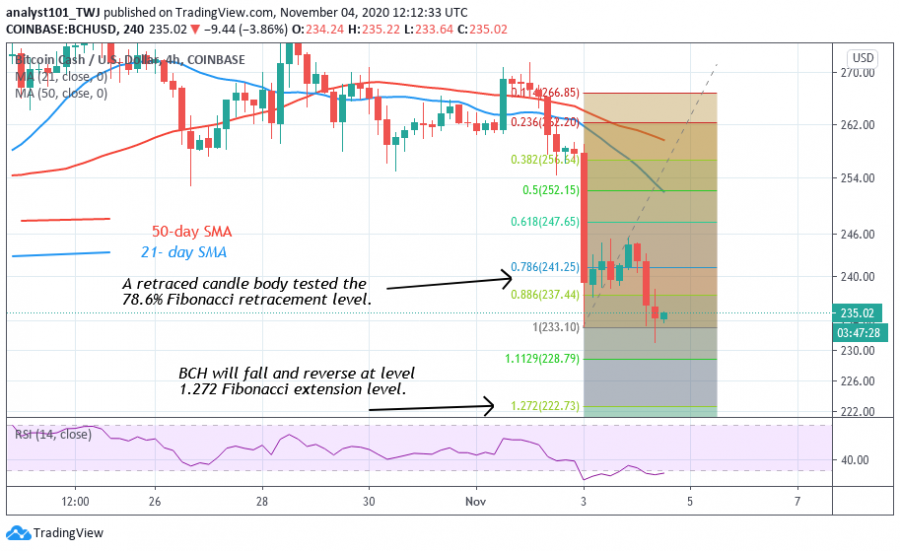
Sellers are attempting to break the previous support at $233; a break down will confirm the Fibonacci tool analysis below. On November 2 downtrend; a retraced candle body tested the 78.6 % Fibonacci retracement level. This implies that the market will fall and reach the low at level 1.272 Fibonacci extensions or the low at $222.79. The coin is likely to reverse at that price level.

Disclaimer. This analysis and forecast are the personal opinions of the author that are not a recommendation to buy or sell cryptocurrency and should not be viewed as an endorsement by Coin Idol. Readers should do their own research before investing funds.
Price
Price
Price
Price
Blockchain

(0 comments)