Bitcoin Cash Unable To Push Above Overhead Resistance, Consolidates Between $280 and $300

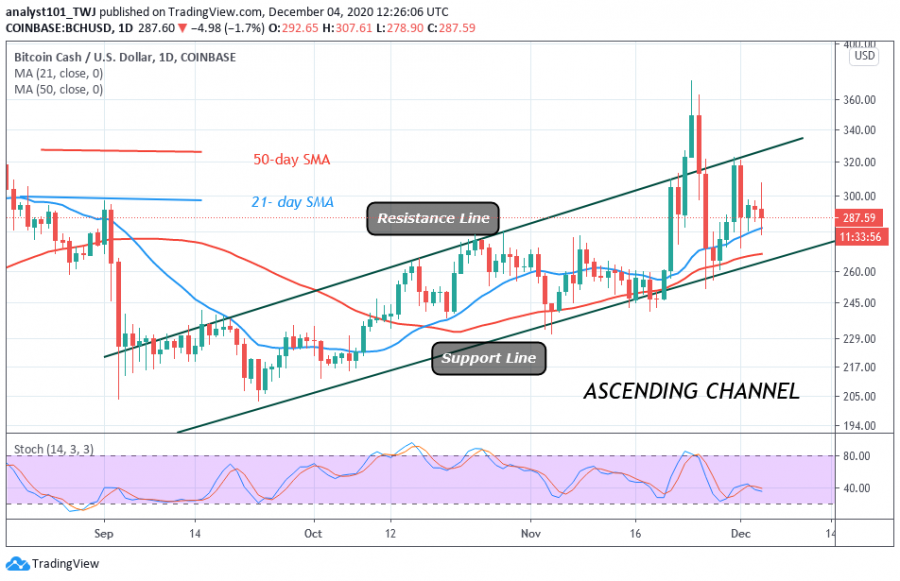
Following its rejection from the $360 and $320 resistance zones, BCH now consolidates in a tight range between $280 and $300 price levels.
In the second uptrend, the bulls could not breach the $320 resistance level as it fell to resume a sideways move. In its current tight range, the coin will encounter a breakout or breakdown at any time. For example, BCH rebounded above the $280 support and rallied above $300.
Simultaneously, it plunged to the same price level. This was as a result of overwhelming selling pressure at a higher price level. The breakout and breakdown will always occur as long as the price moves in a tight range. On the upside, if the upper price range is breached and the momentum is sustained, a retest at the $320 and $360 is likely. Conversely, if the lower price range is broken below, the crypto is likely to decline. In the meantime, BCH is still consolidating in the price range after the price spike.
Bitcoin Cash indicator reading
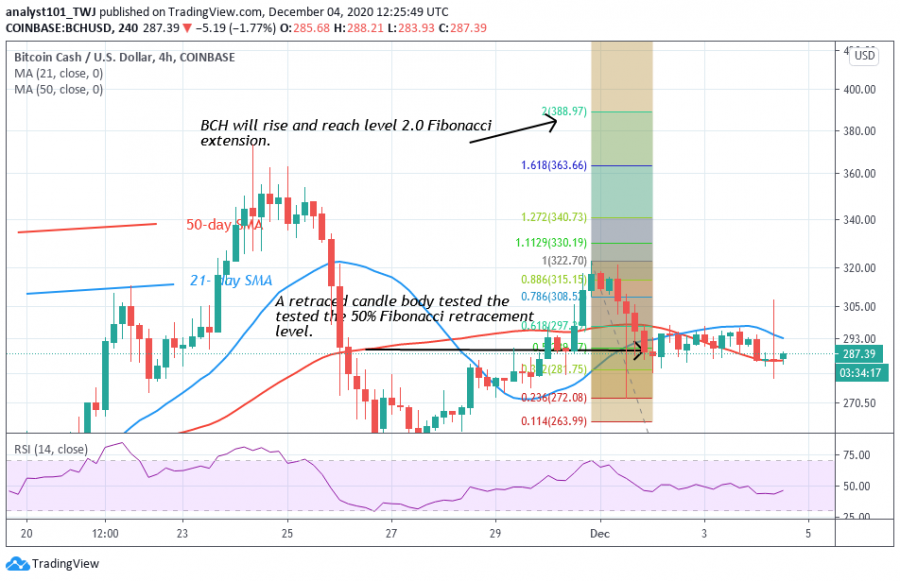
The coin is at level 51 of the Relative strength index period 14. It indicates that there is a balance between supply and demand. BCH is above the 40% range of the daily stochastic. This indicates that it has bullish momentum.

Key Resistance Zones: $440, $480, $520
Key Support Zones: $200, $160, $120
What is the next move for Bitcoin Cash?
The altcoin is likely to move up if the current resistance is breached, On November 30 uptrend, a retraced candle body tested the 50%% Fibonacci retracement level. The retracement indicates that BCH is likely to rise and reach level 2.0 Fibonacci extensions. That is a high of $388.97.

Disclaimer. This analysis and forecast are the personal opinions of the author that are not a recommendation to buy or sell cryptocurrency and should not be viewed as an endorsement by Coin Idol. Readers should do their own research before investing funds.
Price
Price
Price
News
Price

(0 comments)