Bitcoin Cash Breaks Below the Critical Support Level, May Find Support Above $240

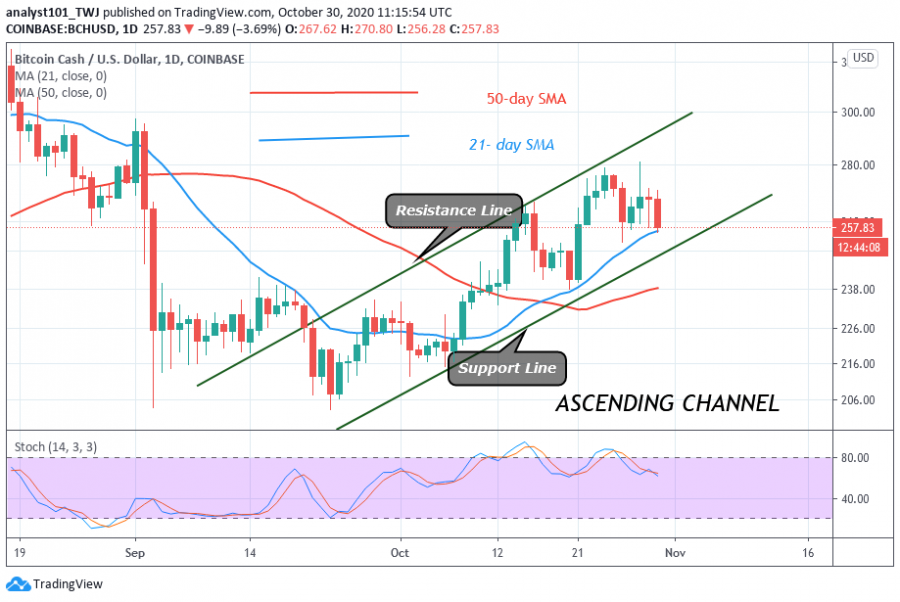
Bitcoin Cash was repelled at the $280 resistance as buyers retested the overhead resistance. This resistance pushed the coin to a $252 low as the market moved up again.
On October 28, the coin retested the $280 overhead resistance and plunged into the previous low. The second retest at the overhead resistance is a confirmation that the selling pressure will continue.
Presently, BCH is falling and the downtrend is likely to affect the $250 critical support level. In other words, the current price fall is going to extend beyond the $250 support. The downtrend is likely to reach a low of $238. Nevertheless, if the bears can defend the $250 support, there is a possibility of a resumption of an upward move. Meanwhile, the coin is falling and has reached a low of $260.99 at the time of writing.
Bitcoin Cash indicator reading
The coin is now below the 80% range of the daily stochastic. Sellers have emerged in the overbought region to push prices downward. The market is still on a downward move. BCH price is approaching the 21-day SMA support. BCH will resume an upward move if the support holds. The selling pressure will continue if the price breaks below the SMAs.

Key Resistance Zones: $440, $480, $520
Key Support Zones: $200, $160, $120
What is the next move for Bitcoin Cash?
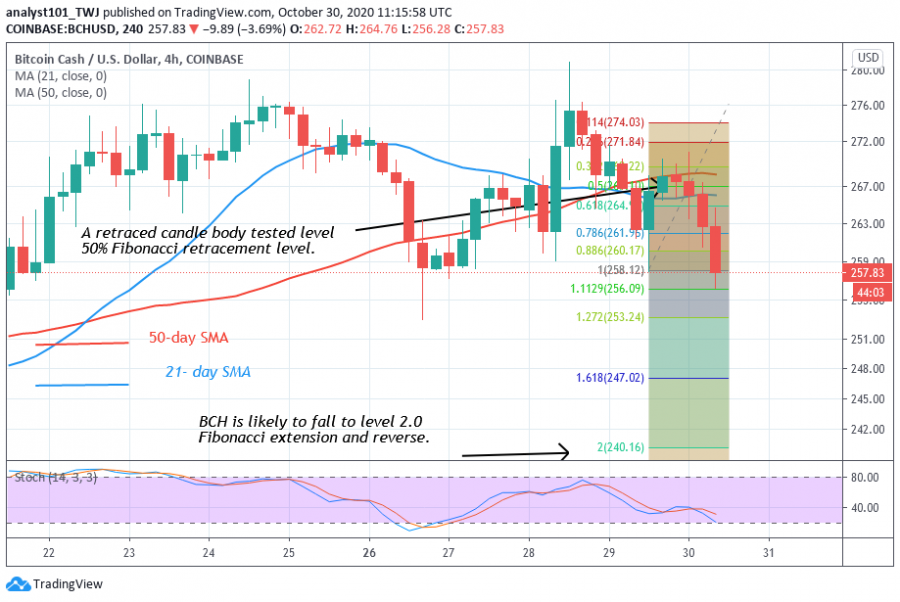
From the price action, the downtrend is ongoing. In the downtrend of October 29, a retraced candle body tested level 50% Fibonacci retracement level. This retracement indicates that the price is likely to reach a low of 2.0 Fibonacci extensions or the low of $240.16

Disclaimer. This analysis and forecast are the personal opinions of the author that are not a recommendation to buy or sell cryptocurrency and should not be viewed as an endorsement by Coin Idol. Readers should do their own research before investing funds.
News
Coin expert
News
Price
Price

(0 comments)