Bitcoin Cash Reaches Bearish Exhaustion, May Resume Uptrend

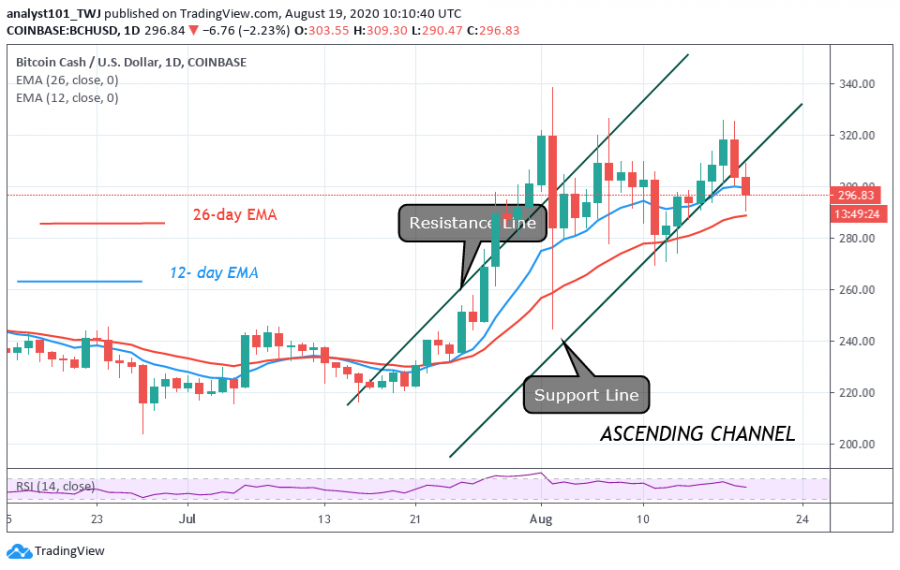
Today, Bitcoin Cash is trading at $297 after the rejection at the $320 resistance. This is the second time buyers will be facing rejection at the same price level.
Each time the crypto faces resistance, the market will fall to the $280 support. As the $280 support holds, the sideways move will resume below the resistance at $320.
This has been the market scenario since August 1. On August 1, BCH had a breakdown, and the crypto plunged from $340 high to $245 low. After the breakdown, BCH resorted to a sideways move between $280 and $320. Neither the bulls nor bears have been able to break the key levels of the market. Meanwhile, the market is still on a downward move and approaching the $280 support.
Bitcoin Cash indicator reading
The recent downward movement of the coin is currently above the 12-day EMA support. BCH will continue to move up if the 12-day EMA support holds. BCH will further depreciate once the EMAs are broken. The RSI period 14 indicates that BCH is at level 54. That is, it is in the uptrend zone and above the centerline 50.

Key Resistance Zones: $440, $480, $520
Key Support Zones: $200, $160, $120
What is the next move for Bitcoin Cash?
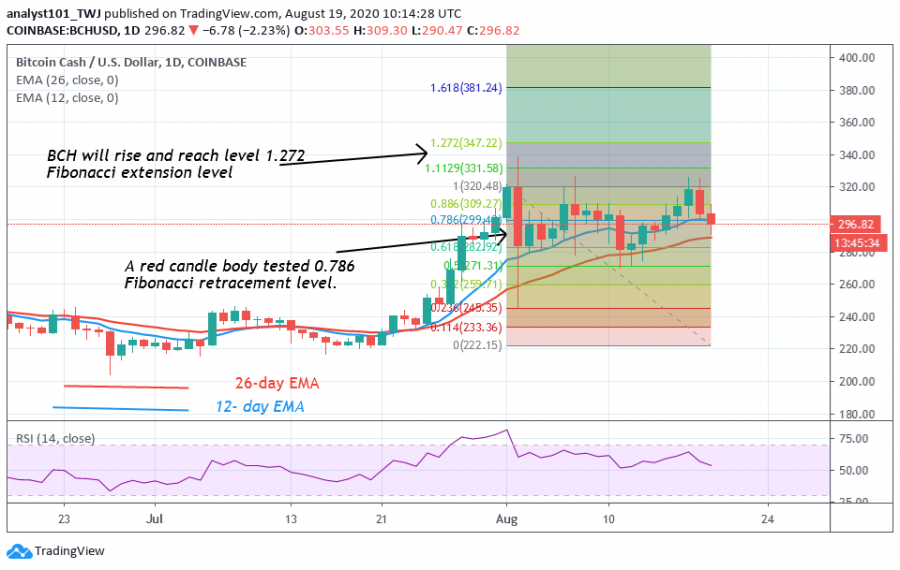
BCH is falling after the resistance at $320 high. The coin has fallen and has reached the 78.6 % Fibonacci retracement level. Any price movement that tested the 1.272 Fibonacci extension level will return to the 78.6% retracement level. The market will resume an upward move if price finds support above $280.

Disclaimer. This analysis and forecast are the personal opinions of the author that are not a recommendation to buy or sell cryptocurrency and should not be viewed as an endorsement by Coin Idol. Readers should do their own research before investing funds.
Business
Price
Price
Price
Price

(0 comments)