Bitcoin Recovers Above $54,000 Support, Poises to Reclaim the $58,000 High

Following its resistance at the psychological price level, Bitcoin slumped and found support above the $54,000 low on March 22. This was the previous low of March 16, when Bitcoin was rejected at the $62,000 overhead resistance.
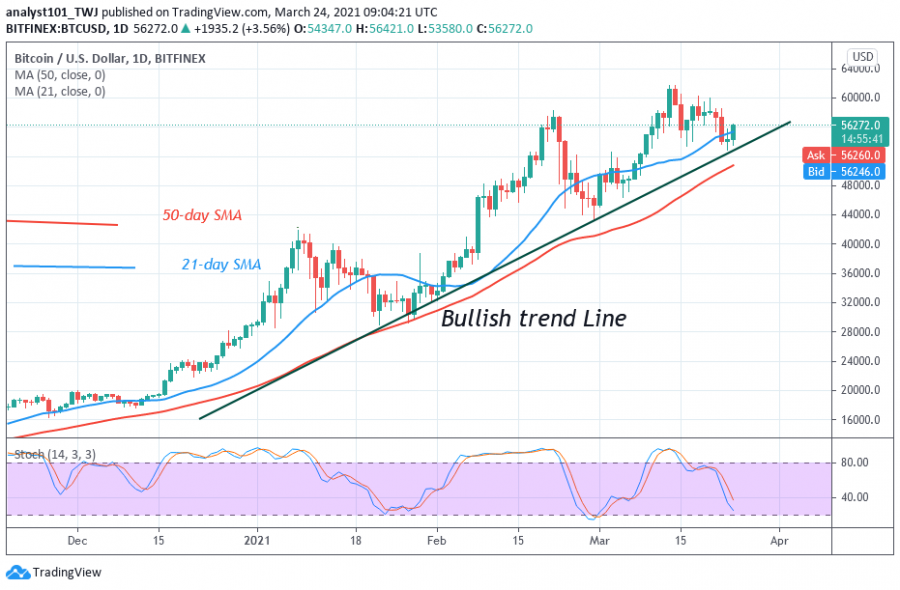
Today, BTC/USD is resuming a fresh uptrend as bulls buy the dips. This can be seen by the long candlestick tails. The long tails indicate that there is strong buying pressure at a lower price level.
After the rebound, BTC price rallies to $57,000 high but yet to break above the resistance. The upside momentum will resume if Bitcoin reclaims the $58,000 support level. This will accelerate BTC’s price on the upside. The bullish scenario is that the bulls will propel price to clear the resistances at $60,000 and $61,699. If they are successful, Bitcoin will resume its uptrend to the next psychological price level above $70,000. In the meantime, Bitcoin is trading at $56,550 at the time of writing.
Bitcoin indicator reading
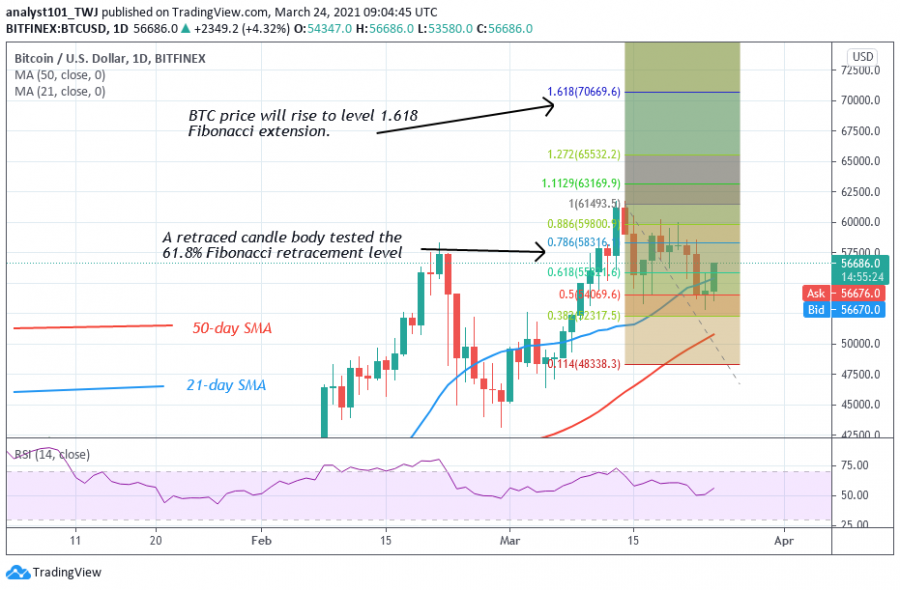
BTC/USD has fallen to level 55 of the Relative Strength Index period 14. This indicates that price is in the uptrend zone and has enough room to rally on the upside. The market is below the 40% range of the daily stochastic. This indicates that price has bearish momentum. This is contrary to the price action as the market resumes its bullish momentum.

Technical indicators:
Major Resistance Levels – $60,000 and $62,000
Major Support Levels – $45,000 and $40,000
What is the next direction for BTC/USD?
Bitcoin has recovered above the $54,000 support as the market resumes upward. If the bulls break the $60,000 resistance, the Fibonacci tool analysis will hold. On March 15, a retraced candle body tested the 61.8 Fibonacci retracement level. The retracement indicates that the market will rise to level 1.618 Fibonacci extensions. That is a high of $70,679.80.

Disclaimer. This analysis and forecast are the personal opinions of the author and not a recommendation to buy or sell cryptocurrency and should not be viewed as an endorsement by CoinIdol. Readers should do their own research before investing funds.
News
Coin expert
News
Price
Price

(0 comments)