Bitcoin Approaches $50,000 Support, May Face Deeper Correction

On April 20, Bitcoin bulls failed to overcome the resistance at $57,000. Consequently, the BTC price slumped to $54,500 low. Buyers responded by pushing the BTC price to the previous highs. The upward correction was repelled at the $56,500 high.
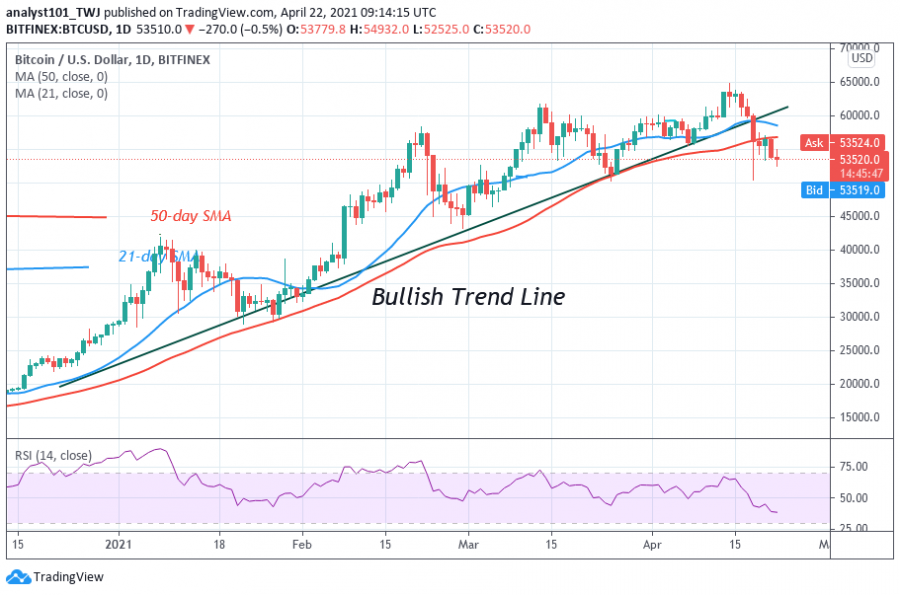
The second rejection pushed the Bitcoin to a low of $52,500. It becomes evident that the market will revisit the $50,000 psychological price level. BTC price is making a series of lower highs and lower lows as price declines. A long candlestick tail is pointing to the $52,500 support which indicates that the bulls have bought the dips as buyers push prices upward.
On the 1 hour chart, a shooting star candlestick is formed pointing to the $55,000 high. The shooting star candlestick indicates that the BTC price has been rejected as buyers attempt to push Bitcoin above the previous high. Another round of selling pressure will resume as the market declines to $50,000 support. Buyers are expected to defend the psychological price level if Bitcoin falls to $50,000 support.
Bitcoin indicator reading
BTC price has fallen below the moving averages which indicate that BTC/USD is trading in the bearish trend zone. Bitcoin is capable of falling in the bearish trend zone. The price also broke below the bullish trend line which suggests that the uptrend has been terminated. However, the uptrend will resume if price recovers above these levels.

Technical indicators:
Major Resistance Levels – $65,000 and $70,000
Major Support Levels – $50,000 and $48,000
What is the next direction for BTC/USD?
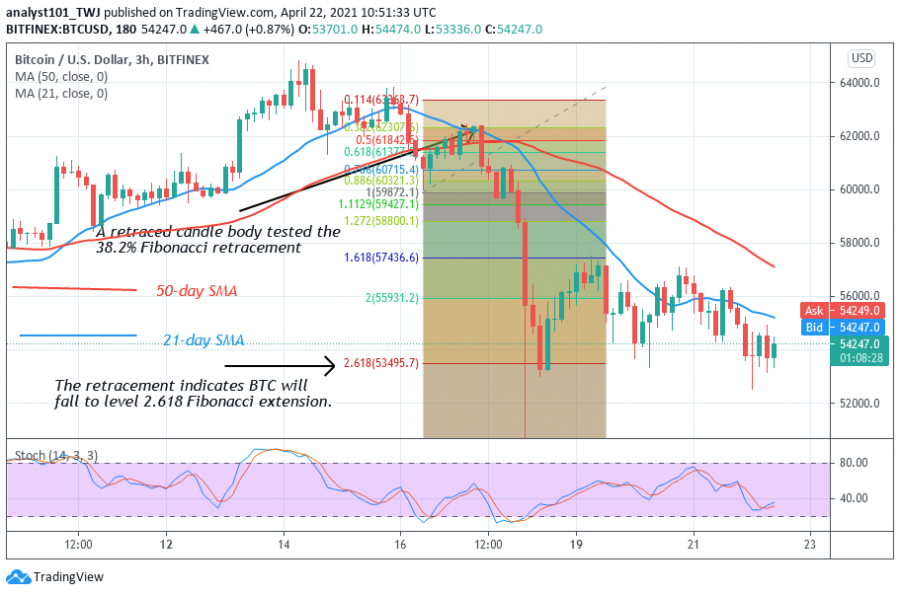
Presently, Bitcoin is in a downward correction as price fluctuates between $52,500 and $57,000. A break below the current support will mean that Bitcoin will fall into a deeper correction. The Fibonacci tool has indicated a further downward movement of price. On April 16 downtrend; a retraced candle body tested the 38.2% Fibonacci retracement level. This retracement implies that the market will fall to level 2.618 Fibonacci extension or the low of $53,495.70. From the price action, the market has been consolidating above the Fibonacci extension level.

Disclaimer. This analysis and forecast are the personal opinions of the author that are not a recommendation to buy or sell cryptocurrency and should not be viewed as an endorsement by CoinIdol. Readers should do their own research before investing funds.
Price
Price
Price
Price
Price

(0 comments)