Binance Coin Price Recovers When Resistance Is Reached Again At $645

The price of Binance coin (BNB) continued its uptrend and rose above the 21-day SMA. Price analysis by Coinidol.com.
Long-term outlook for BNB price: bullish
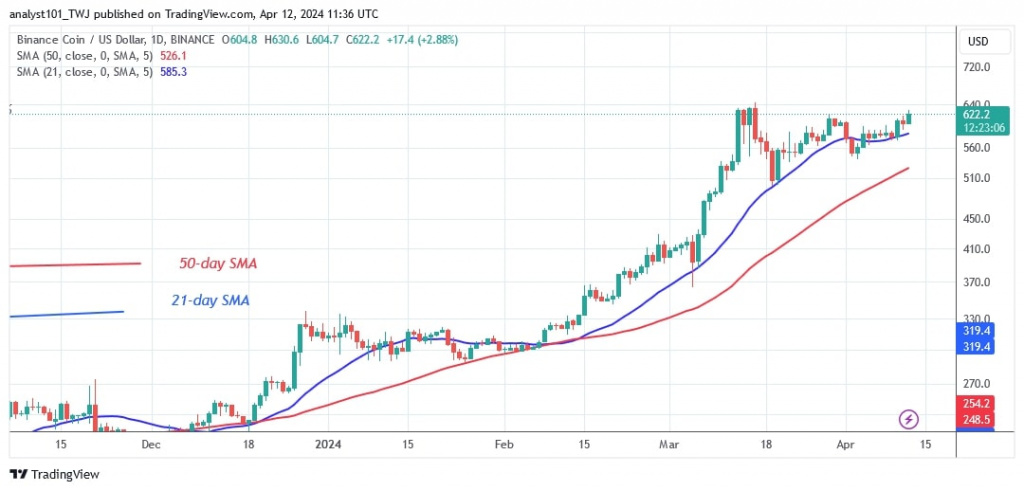
The bears have once again failed to push BNB below the moving average lines. BNB would have fallen to prices as low as $510 and as high as $420. The buyers overpowered the bears by keeping the price above the moving average lines. BNB is currently trading above the 21-day moving average line but below the barrier at $640. Doji candlesticks have slowed the price's uptrend.
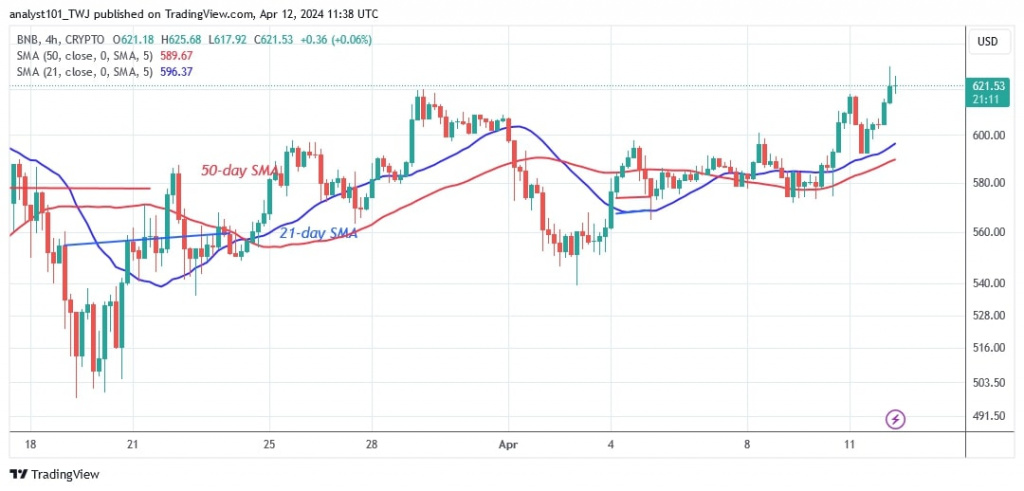
Nonetheless, buyers are trying to push the altcoin above the $645 resistance. BNB's price target is $700. However, if the 21-day SMA support is breached, the bullish scenario would be invalidated. BNB will fall to the next support above the 50-day SMA or the low of $604.
BNB indicator reading
The BNB price bars are above the upward sloping moving average lines. The 21-day SMA serves as a support line for the cryptocurrency's uptrend. On the 4-hour chart, the moving average lines are horizontal, indicating the current trend.
Technical indicators:
Key resistance levels – $600, $650, $700
Key support levels – $400, $350, $300

What is the next direction for BNB/USD?
BNB remains in a sideways trend below the overhead resistance of $645. The horizontal trend will be broken if the bulls break through the resistance at $645. The bears will break the sideways trend by breaking below the moving average lines.

Disclaimer. This analysis and forecast are the personal opinions of the author and are not a recommendation to buy or sell cryptocurrency and should not be viewed as an endorsement by CoinIdol.com. Readers should do their research before investing in funds.
News
Price
Price
Price
Price

(0 comments)