Binance Coin Retests $280 High but Declines to Resume Sideways Trend

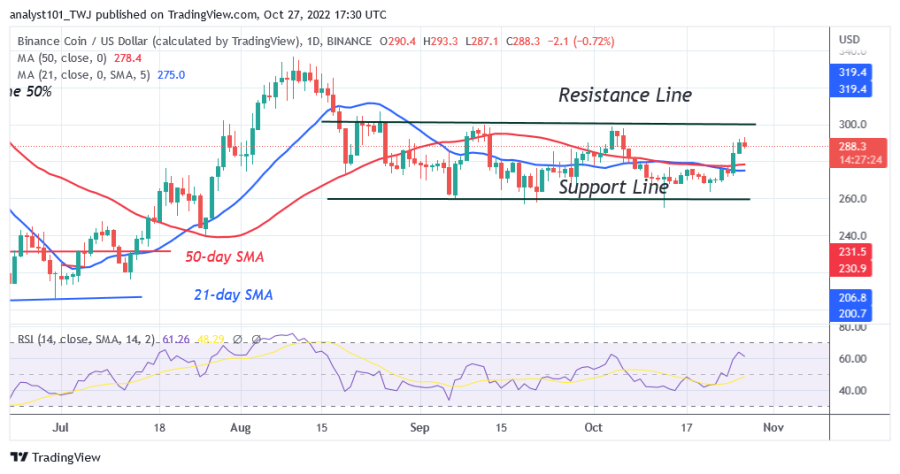
Binance Coin (BNB) price broke through the moving average lines as the altcoin reached the high of $292. The upward movement was interrupted at the recent high.
The cryptocurrency may have rallied to the overhead resistance at $336 if buyers overcome the initial resistance at $280. The altcoin is falling back from $280. Sellers have emerged and are pushing prices down. If BNB meets rejection at the $280 high, it will fall below the moving average lines and resume its sideways movement. At the time of writing, the price is trading at $287.
Binance Coin indicator reading
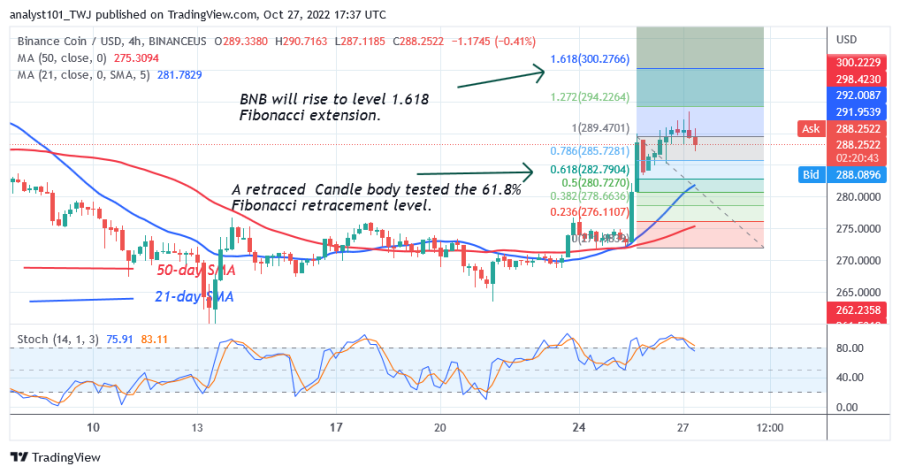
BNB has risen to level 60 on the Relative Strength Index for period 14. The altcoin is capable of further movement as it is trading in the bullish trend zone. The sideways movement is indicated by the horizontal flatness of the 21-day and 50-day SMAs. Binance Coin has risen into the overbought zone above the 80% of the daily stochastics.

Technical indicators:
Major Resistance Levels - $600, $650, $700
Major Support Levels - $300, $250, $200
What is the next direction for BNB
The crypto is in an uptrend towards the previous highs. Currently, it has reached a high of $288 and could continue to rise. On October 25, the uptrend saw a retraced candlestick testing the 61.8% Fibonacci retracement level. The retracement suggests that BNB will rise to the 1.618 Fibonacci Extension level or $300.

Disclaimer. This analysis and forecast are the personal opinions of the author and are not a recommendation to buy or sell cryptocurrency and should not be viewed as an endorsement by CoinIdol. Readers should do their research before investing in funds.
Price
Price
Price
Price
Price

(0 comments)