Binance Coin Halts Above $208 As It Makes Positive Moves

Binance coin (BNB) price has retreated below the moving average lines after being rejected from the previous high. Binance coin price analysis by Coinidol.com.
BNB Price Long Term Forecast: Bearish
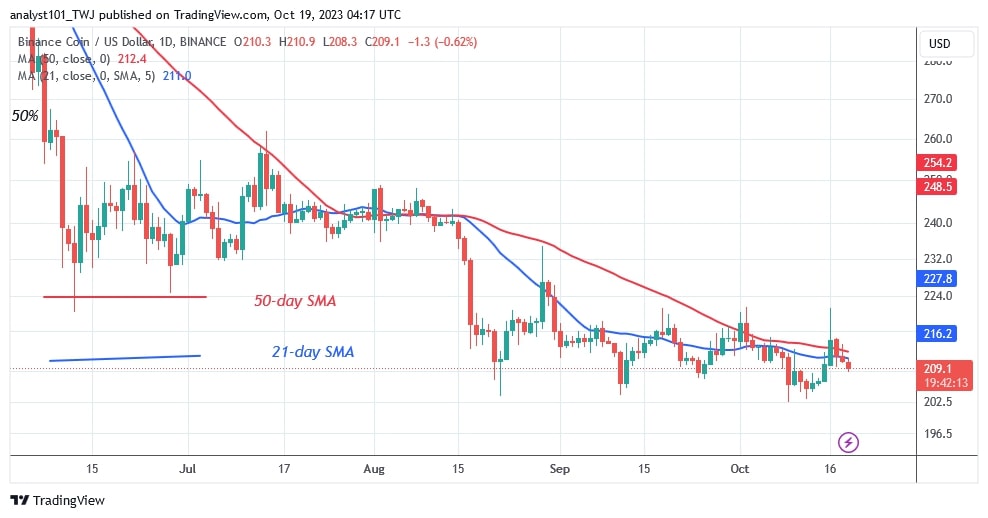
The decline has stalled after BNB hit a low of $208. The altcoin is trading at $210.50 at the time of writing. The rejections have been occurring since the price dropped on August 17. After each rejection, a candle with a long wick appears pointing up. This indicates that BNB is under heavy selling pressure at higher price levels.
For example, resistance at $220 limits the upside. On the downside, BNB has remained above the $200 level. Long downward candlestick tails indicate significant buying pressure at lower price levels. Currently, BNB's price range is limited to $200 to $213.
Technical Indicators:
Key resistance levels – $300, $350, $400
Key support levels – $200, $150, $100

Binance Coin Indicator Display
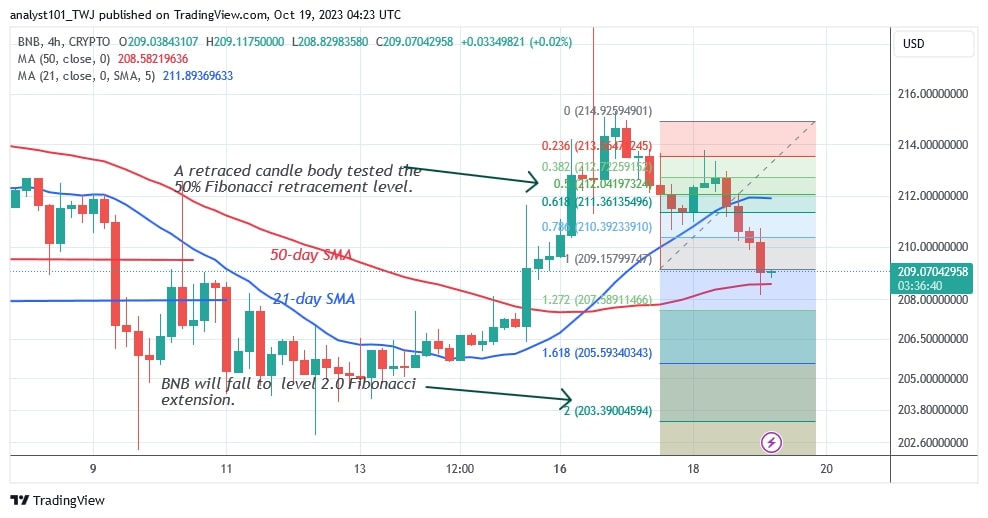
After the recent price decline, the BNB price bars are below the moving average lines. This indicates a further decline in the cryptocurrency value. The market has reached the oversold zone in this situation. On the 4-hour chart, the BNB price is between the moving average lines. This explains why the altcoin is expected to trend sideways for a few days.
What is the next direction for BNB/USD?
Binance Coin will move sideways again if it stays above the $208 support level. BNB is likely to fluctuate in the lower time frame as it is trapped between the moving average lines. However, the price indication predicts a further decline to a low of $203. On the downside, selling pressure will resume if the bears break the $208 support.
On October 12, Coinidol.com reported that BNB prices have remained stable as selling pressure has reached bearish exhaustion.

Disclaimer. This analysis and forecast are the personal opinions of the author and are not a recommendation to buy or sell cryptocurrency and should not be viewed as an endorsement by CoinIdol.com. Readers should do their research before investing in funds.
Price
Price
Price
Price
News

(0 comments)