Binance Coin Consolidates Above $260 as Buyers Challenge Resistance at $300
Updated: Sep 22, 2022 at 12:21

Binance Coin (BNB) price is still in a downtrend as buyers try to break the 21-day line SMA.
Binance Coin price long term forecast: bearish
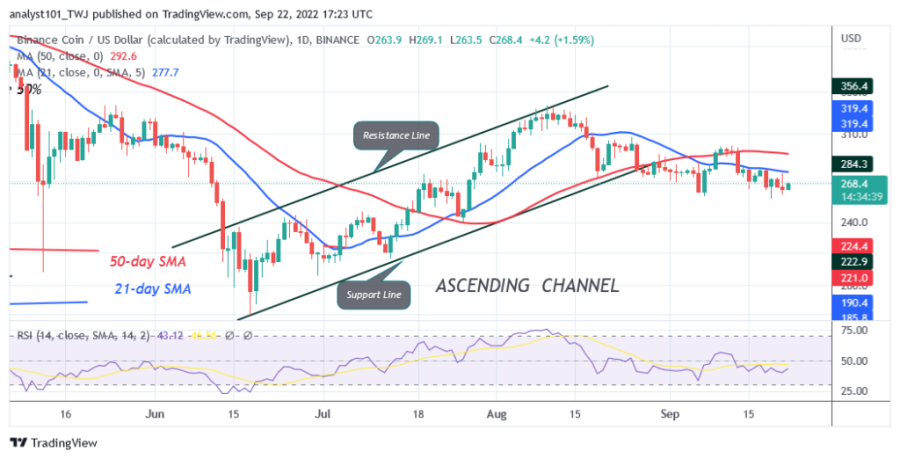
Since September 6, buyers have failed to keep the BNB price above the moving average lines. On September 10, the altcoin rallied above the moving average lines but was rejected at the $300 resistance zone.
BNB would have regained the overhead resistance at $332 if buyers had overcome the current resistance at $300. Binance Coin is now fluctuating below the moving average lines. If BNB turns down from the moving average lines, the altcoin will fall to the current support at $261.50. The downside momentum will extend to the price level of $220 or $244 if the current support is broken.
Binance Coin indicator display
BNB is at level 43 of the Relative Strength Index for period 14. The cryptocurrency is in a downtrend as buyers try to break the 21-day line SMA. The 21-day line SMA and the 50-day line SMA are horizontally sloping, indicating a sideways movement. The price bars are below the moving average lines, indicating a further decline. The cryptocurrency is below the 50% area of the daily stochastic. This indicates that the market is in a bearish momentum.

Technical Indicators:
Key resistance levels - $600, $650, $700
Key support levels - $300, $250, $200
What is the next direction for BNB/USD?
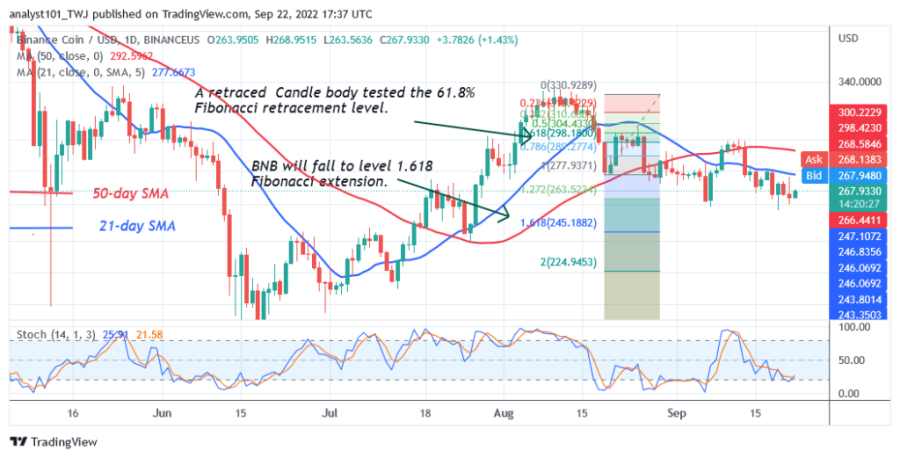
Binance Coin is preparing for a possible decline if BNB turns down from the moving average lines. In the meantime, the altcoin is fluctuating below the moving average lines and above the current support. Meanwhile, the August 19 downtrend has retraced a candlestick that tested the 61.8% Fibonacci retracement level. The retracement suggests that BNB will fall to the 1,618 Fibonacci extension level or $245.18.

Disclaimer. This analysis and forecast are the personal opinions of the author and are not a recommendation to buy or sell cryptocurrency and should not be viewed as an endorsement by CoinIdol. Readers should do their research before investing in funds.
News
Price
Price
News
Price

(0 comments)