Binance Coin Consolidates but May Slide Down to $244 Low
Updated: Oct 21, 2022 at 11:12

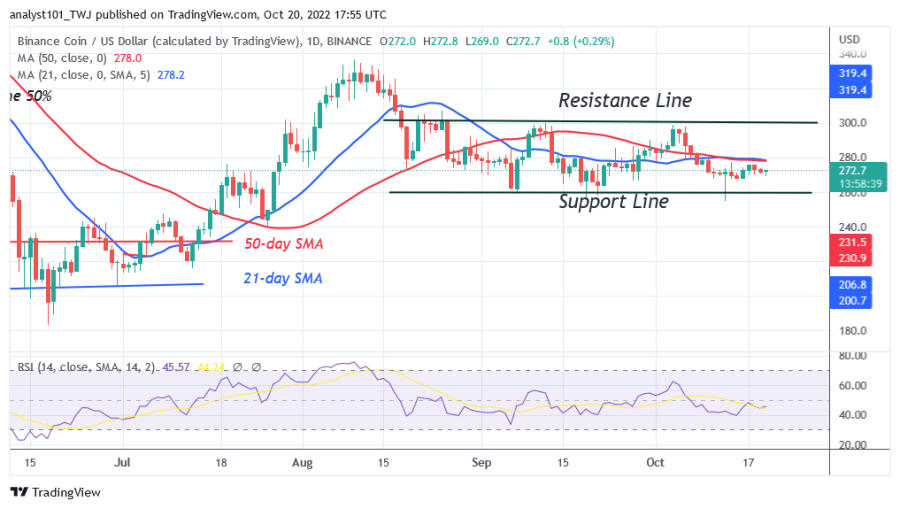
Binance Coin (BNB) price is still in a narrow trading range. Since the price collapse on October 10, BNB has been hovering between $260 and $280.
Sellers have the upper hand as they retest current support in an attempt to break through it. For example, on October 13, BNB fell sharply and broke below the current support at $260. Bulls immediately bought the price declines when BNB traded above the $270 support. The long candle tail indicates strong buying pressure at lower price levels. Meanwhile, BNB/USD is trading at $27.27 as of press time.
Binance Coin indicator reading
The upward correction has pushed BNB to level 45 on the Relative Strength Index for the 14 period. The 21-day and 50-day SMAs are horizontally flat, indicating sideways movement. The altcoin is in a bullish momentum above the 30% area of the daily stochastic. The cryptocurrency price bars are dominated by doji candlesticks.

Technical indicators:
Major Resistance Levels - $600, $650, $700
Major Support Levels - $300, $250, $200
What is the next direction for BNB?
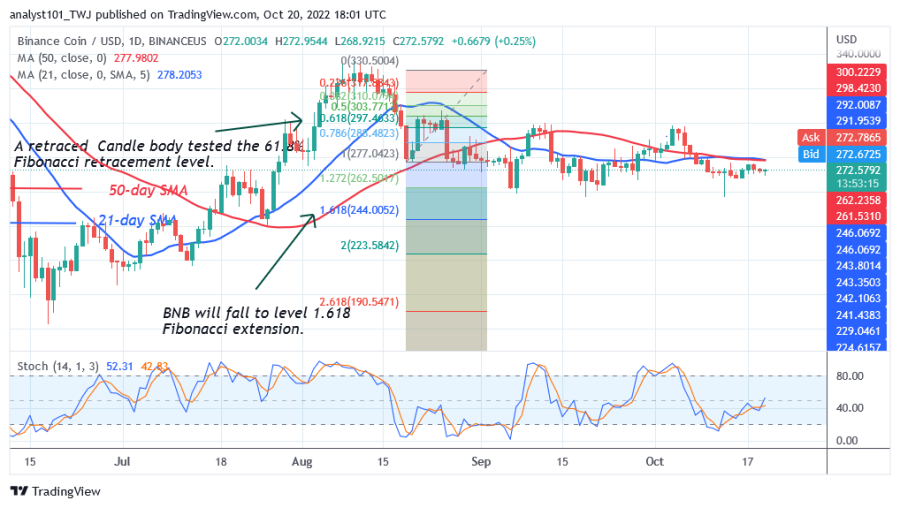
Binance Coin is consolidating below the moving average lines. According to the analysis of the Fibonacci tool, BNB will continue to fall to the level 1,618 Fibonacci Extension or $244.00. From the price action, the bears have to break the current support to reach another support.

Disclaimer. This analysis and forecast are the personal opinions of the author and are not a recommendation to buy or sell cryptocurrency and should not be viewed as an endorsement by CoinIdol. Readers should do their research before investing in funds.
Price
Price
News
News
Coin expert

(0 comments)