Weekly Cryptocurrency Market Analysis: Altcoins Rally As Bulls Break Through More Resistance Levels

Top altcoins resumed their uptrend this week as they break through more resistance levels.
Due to the strong uptrend at the moment, altcoins are not affected by the overbought market. However, a market that is in a strong uptrend cannot remain in an overbought condition. Let us talk about a few of these cryptocurrencies.
dYdX
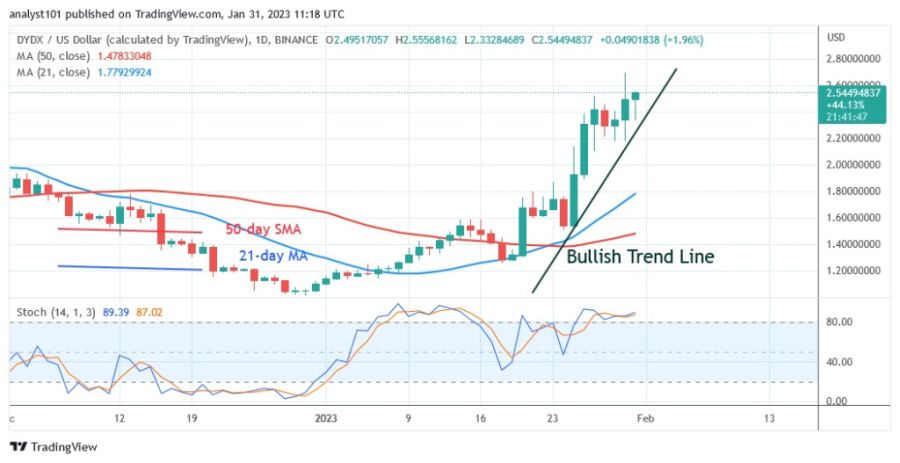
dYdX (DYDX), which has risen to a high of $2.69, is currently in an uptrend. The altcoin has recovered to its historical price on August 1. The price of DYDX has risen into an overbought area of the market. If the price rises above the overriding resistance, further gains are possible. However, since August 1, buyers have failed to keep the price above the $2.72 resistance level. Each time DYDX retests the overhead resistance at the recent high, it will fall. Below the moving average line, the altcoin will fall. Once it breaks the resistance level, the altcoin will continue to rise. The daily stochastic shows that the altcoin is at 80. The area of overbought has been reached. The following characteristics apply to the altcoin, which is the best performing cryptocurrency:
Current price: $2.65
Market capitalization: $2,653,548,180
Trading volume: $263,730,474
7-day gain/loss: 37.91%
Mina
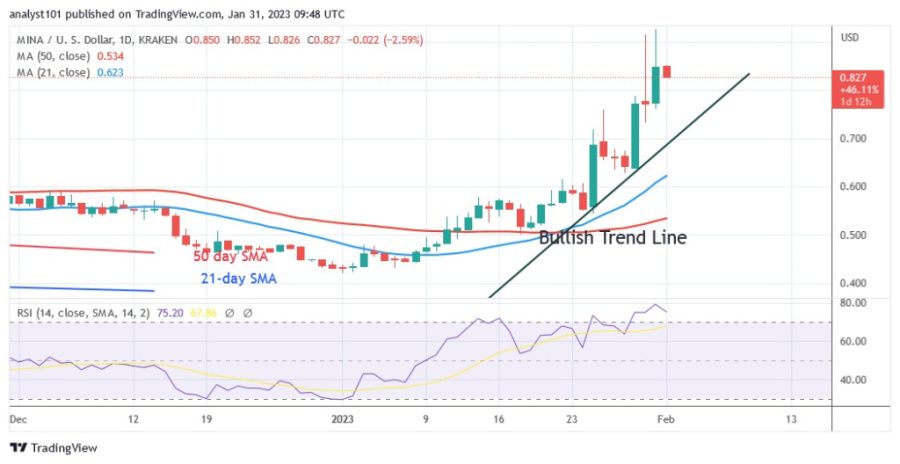
Mina (MINA) is getting more and more expensive. The altcoin is experiencing a series of higher highs and higher lows. The price of MINA reached a high of $0.92 on January 31, and the market is overbought at the current price level. It is approaching the historically high price of $0.99 on August 10, 2022, but the cryptocurrency has already surpassed the resistance level of $0.81, or the price level of November 5, 2022. The cryptocurrency value reached the overbought zone of the market on November 5 and was rejected. The altcoin fell to a low of $0.42 before starting a new uptrend. Today, the altcoin is back to where it was previously overbought. For the period 14, MINA /USD is at level 76 of the Relative Strength Index. MINA is the second best performing cryptocurrency. It has the following characteristics:
Current price: $0.8345
Market capitalization: $681,283,314
Trading volume: $176,923,947
7-day gain/loss: 31.72%
Aptos
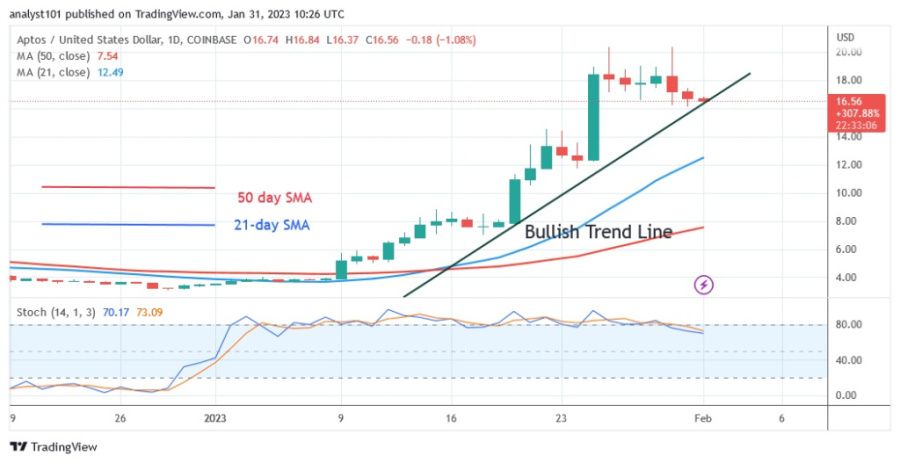
The price of Aptos (APT) is also on the rise, but it is on the decline after reaching the resistance at $20. The price of the altcoin has a series of higher highs and higher lows. Since January 26, the altcoin has been near the $20 resistance level. If the price falls back below the trend line or the 21-day line SMA, the current uptrend would be over. The market will reach a high of $29 if the current resistance is overcome. The altcoin is currently bearish. It will fall below the moving average lines and possibly drop to $12. APT is experiencing bearish momentum below the daily stochastic level of 80. It has the following characteristics and ranks third among all cryptocurrencies:
Current price: $16.52
Market capitalization: $16.864.534.533
Trading volume: $996,430,408
7-day gain/loss: 28.73%
Fantom
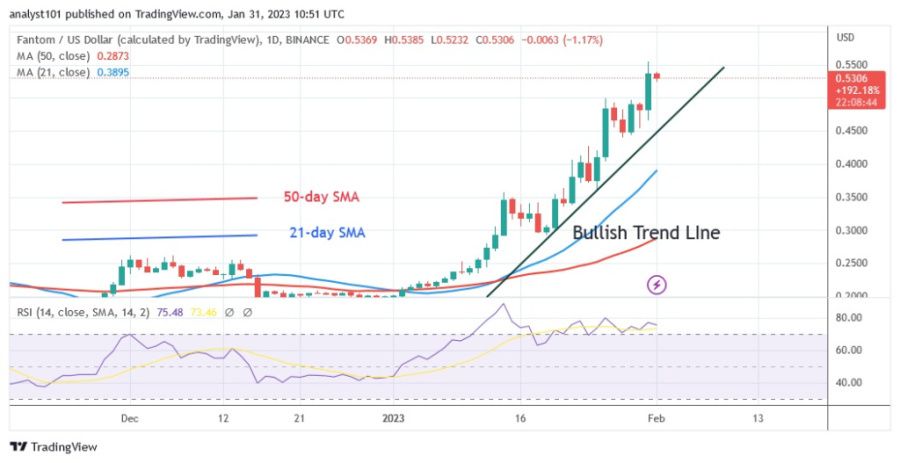
Fantom (FTM) is in an uptrend and has reached a high of $0.55. The upward movement has continued although the price has entered the overbought zone. On January 14, the altcoin reached the overbought zone at $0.35. Before rising to the recent high of $0.41, it returned to the low of $0.29. With the break of the resistance levels, the bullish momentum has strengthened to a high of $0.55. If the bullish momentum continues, the market will rise to a high between $0.75 and $0.85. The cryptocurrency's Relative Strength Index is at 75 for the 14 period, and the altcoin is overbought and could fall. It is the fourth best performing cryptocurrency and has the following characteristics:
Current price: $0.5306
Market capitalization: $1,684,594,568
Trading volume: $617,239,665
7-day gain/loss: 16,42%
Dash
With the resumption of the upswing, the price of Dash (DASH) is currently trading in the uptrend zone. The cryptocurrency has reached a high of $60. Since the price broke through resistance at $48 on December 12, the uptrend has been stopped at the recent high. Further growth is unlikely as the market has now entered the overbought zone. DASH has overcome the $52 resistance level and reached a high of $60. However, the cryptocurrency will fall below the moving average lines if it is rejected. The daily stochastic level of 80 is exceeded by DASH. This shows that the overbought zone of the market has been reached. DASH is the fifth best performing cryptocurrency. It has the following characteristics:
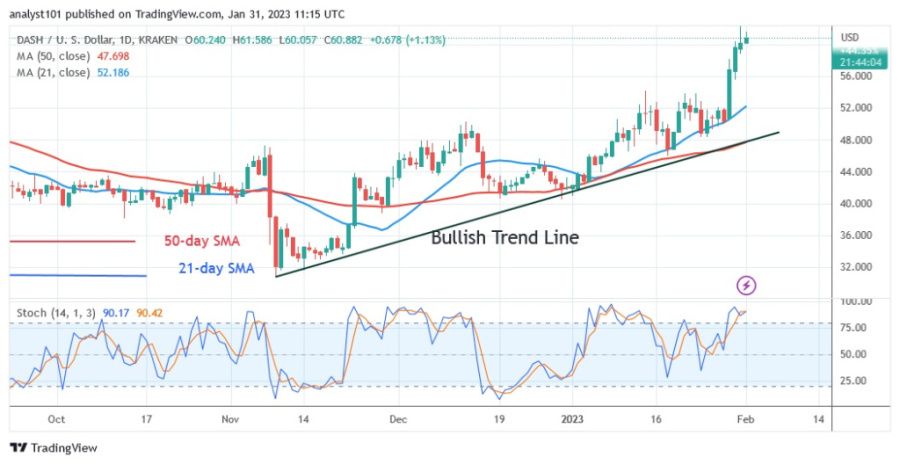
Current price: $60.88
Market capitalization: $1,150,302,019
Trading volume: $132,730,609
7-day gain/loss: 15.58%
Disclaimer. This analysis and forecast are the personal opinions of the author and are not a recommendation to buy or sell cryptocurrency and should not be viewed as an endorsement by CoinIdol. Readers should do their research before investing in funds.
Price
Price
Price
Price
Price

(0 comments)