Weekly Cryptocurrency Market Analysis: Altcoins Hold above Previous Lows Set for a Possible Rally

Since May 12, cryptocurrencies have managed to hold above their previous lows. Altcoins have made an upward correction as they tried to break through the next resistance levels. Breaking through the next resistance levels will set up a possible rally.
Kyber Network Crystal v2
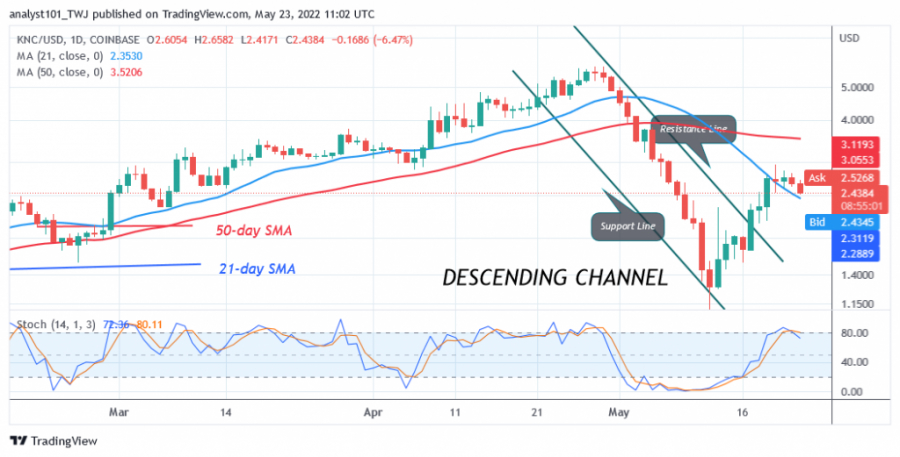
Kyber Network Crystal (KNC) is in a downtrend but made an upward correction when it broke above the 21-day line SMA. The price of the cryptocurrency is moving back above the indicator. The altcoin will move back within a trading range if the crypto price stays above the line. That is, the market will fluctuate between the 21-day line SMA and the 50-day line SMA. The uptrend will resume when the price crosses the 50-day moving average. Likewise, selling pressure will resume when the 21-day line average is breached.
Meanwhile, KNC is on the retreat and if the price drops below the 21-day line SMA, the altcoin will return to its previous low at $1.15. KNC is the best performing cryptocurrency in the past week.
It has the following characteristics:
Price: $2.43
Market capitalization: $429,527,924
Trading volume: $172,297,685
7-day gain: 57.77%
Fantom
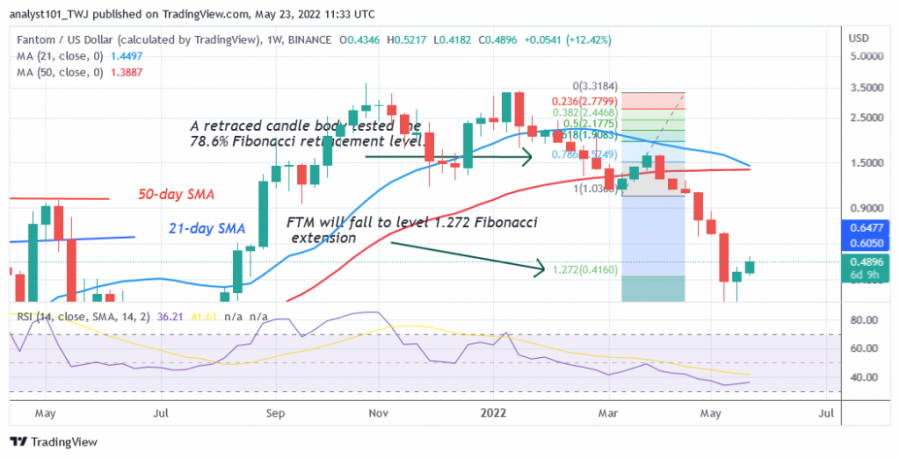
Fantom (FTM) is in a downtrend. Selling pressure resumed after the formation of a bearish double top pattern. The cryptocurrency fell from a high of $3.68 to a low of $0.22. The altcoin fell to the low of the historical price level of June 7, 2021. The current support holds while the altcoin resumes a new uptrend.
Meanwhile, a candlestick on the weekly chart tested the 78.6% Fibonacci retracement level on March 28. The retracement suggests that FTM will fall to the 1.272 Fibonacci Extension level or $0.41. The price action shows that the altcoin has retested the 1.272 Fibonacci extension level and is showing bullish momentum again. It is the cryptocurrency with the second best performance last week. It has the following characteristics:
Price: $0.4872
Market capitalization: $1,546,795,391
Trading volume: $730,354,111
7-day gain: 38.29%
Bitcoin Gold
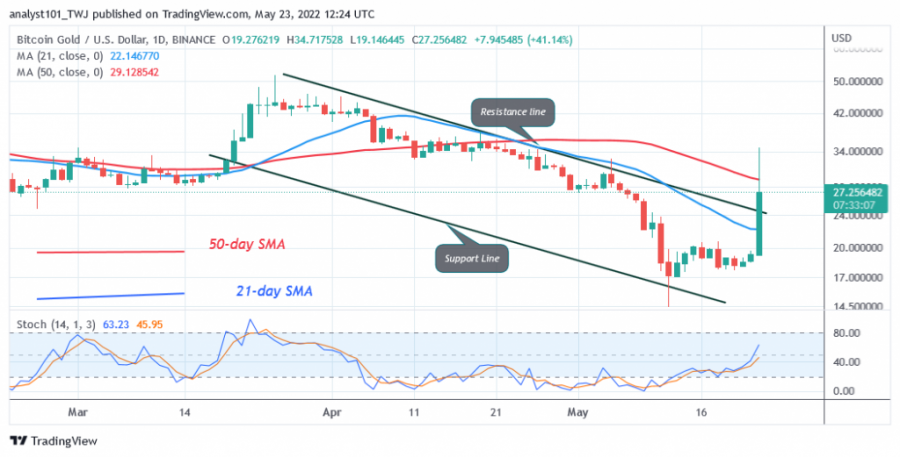
Bitcoin Gold (BTG) is in a downtrend as it fell to the low of $14 on May 12. The downtrend has eased as the altcoin has risen above the current support. BTG price recovered and broke above the moving averages but fell back. The cryptocurrency price is above the 21-day line SMA but below the 50-day line SMA. The cryptocurrency will try to move back within a trading range if the price stays between the moving averages.
The current uptrend will continue if the price breaks above the 50-day line SMA. The altcoin will rise to regain the previous high of $50. However, the downtrend will resume if the price falls below the 21-day line SMA. It is the cryptocurrency asset with the third best performance last week. It has the following characteristics:
Price: $27.19
Market capitalization: $571,035,439
Trading volume: $185,546,119
7-day gain: 36.20%
Loopring
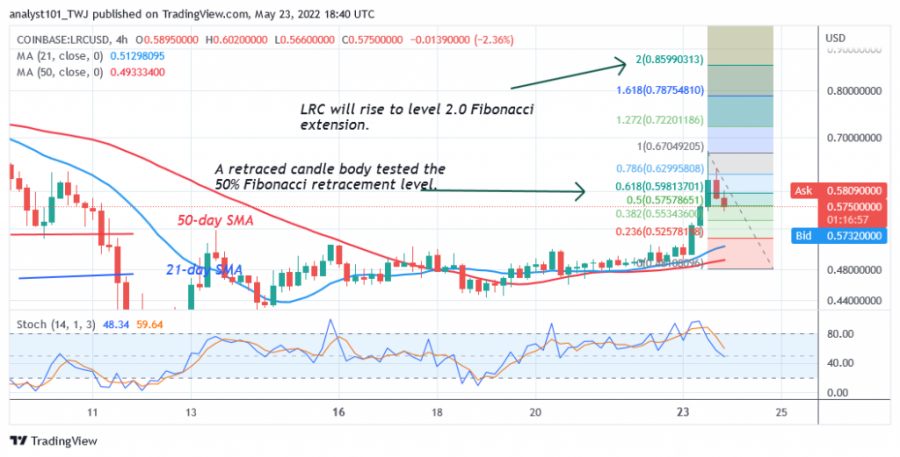
Loopring (LRC) is in a downtrend but has regained bullish momentum. On the daily chart, the bulls have broken above the 21-day line SMA but fail to break above the 50-day line SMA. The upward correction reached the high of $0.67, but was rejected. It can be concluded that the coin is still in the downtrend zone and can fall downwards. The uptrend will continue if the price finds support above $0.50.
Meanwhile, the May 23 uptrend tested the 50% Fibonacci retracement level with a retreating candlestick. The retracement suggests that LRC will rise to the 2.0 Fibonacci extension level or the $0.85 price level. It is the cryptocurrency with the fourth best performance last week. It has the following characteristics:
Price: $0.5911
Market capitalization: $812,473,836
Trading volume: $390,133,846
7-day gain: 30.80%
Aave
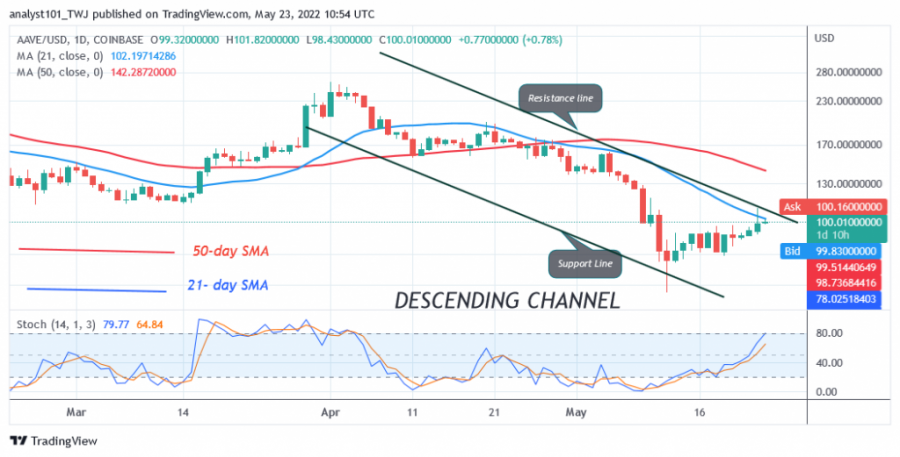
Aave (AAVE) is in a downtrend as it fell to a low of $61 on May 12. Prior to the downtrend, the cryptocurrency had made an upward correction to a high of $261 on April 1. Today, the price decline continues as it recovered above the previous low and reached the high of $109. Currently, Aave is facing resistance at the 21-day line SMA. A break above the 21-day moving average would propel the altcoin to a high of $200.
However, a rejection at the moving averages will bring the altcoin down. Aave will fall and retake the previous low at $61. AAVE/USD is now above the 70% area of the daily stochastic. It is in a bullish momentum and approaching the overbought area of the market. The cryptocurrency will fall in the overbought area. AAVE is the cryptocurrency with the fifth best performance last week. It has the following characteristics:
Price: $99.84
Market capitalization: $1,597,452,124
Trading volume: $340,028,105
7-day gain: 25.15%.
Disclaimer. This analysis and forecast are the personal opinions of the author and are not a recommendation to buy or sell cryptocurrency and should not be viewed as an endorsement by CoinIdol. Readers should do their research before investing funds.
Price
Price
Price
Price
Price

(0 comments)