Weekly Cryptocurrency Market Analysis: Altcoins Reach Bearish Exhaustion And Are About To Change Direction
Updated: Jun 12, 2023 at 12:42

Cryptocurrency markets continue to decline as altcoins trade in the bearish trend zone.
Ripple is currently trading above its moving average lines and is the best performing cryptocurrency this week. BDX, PAXG, LEO and MKR seem to be struggling in the bearish trend zone. So let us take a closer look at some of these cryptocurrencies.
XRP
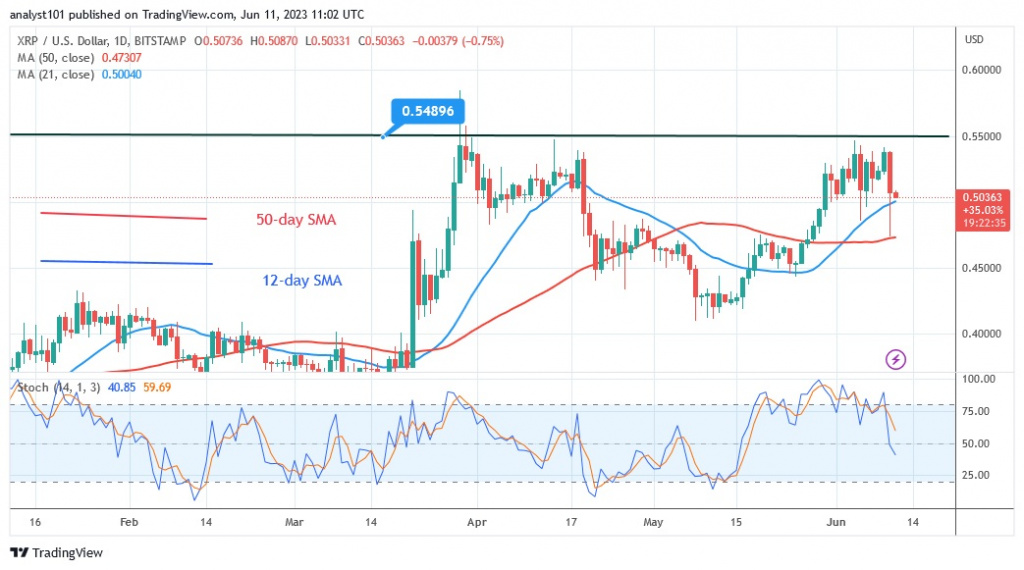
The price of Ripple (XRP) is moving sideways below the overriding resistance. The altcoin has been bouncing below the $0.55 barrier area since May 30 in preparation for a breakout. However, today XRP is falling as it fails to surpass the recent high. The altcoin is currently selling for $0.50. If XRP retraces above the moving average lines, the cryptocurrency will continue to attack the barrier to the upside. However, if the altcoin falls below the moving average lines, the sideways trend will resume. Thus, the price of the altcoin has been fluctuating between $0.42 and $0.55 since March 29. The cryptocurrency asset is currently in a bearish momentum below the daily stochastic level of 50.XRP is the top cryptocurrency of the week and has the following characteristics:
Current price: $0.5059
Market capitalization: $50.665.085.216
Trading volume: $26B
7-day gain/loss: 20.65%
Beldex
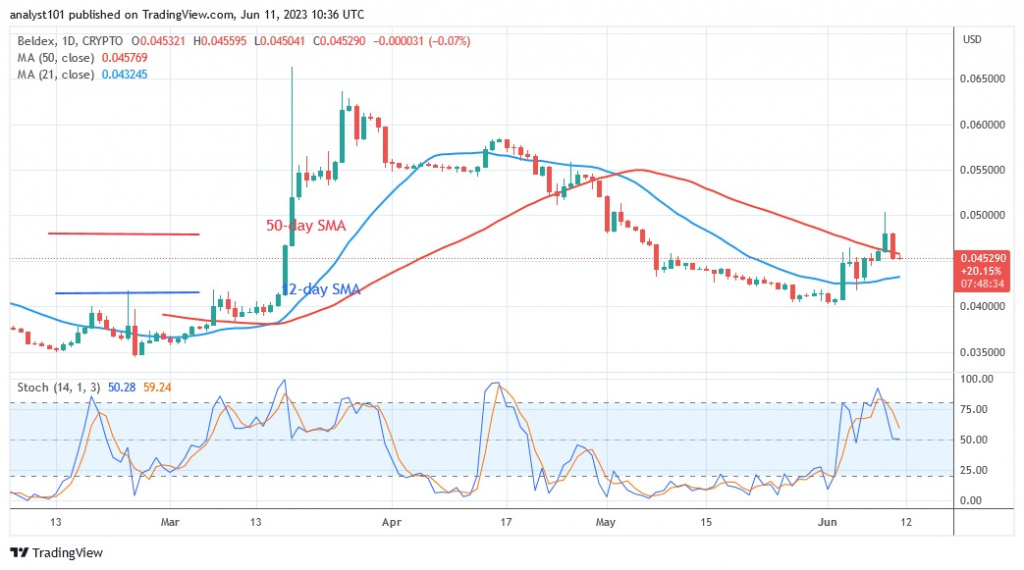
Beldex (BDX) is moving correctly as it runs above the moving average lines. The upside correction is rejected at the high of $0.050. The altcoin has regained the top position above the moving average lines. At the time of writing, it is trading at $0.045. The price will continue to move higher if it finds support above the moving average lines. If the $0.050 ceiling is broken, the price of BDX will rise to $0.063. However, the altcoin will continue its previous decline if it falls below the moving average. BDX will fall to its previous low of $0.040. Above the daily stochastic threshold of 50, the altcoin is in an uptrend. The second best cryptocurrency, BDX, has the following characteristics:
Current price: $0.040602
Market capitalization: $455,450,647
Trading volume: $4M
7-day gain/loss: 1.44%
PAX Gold
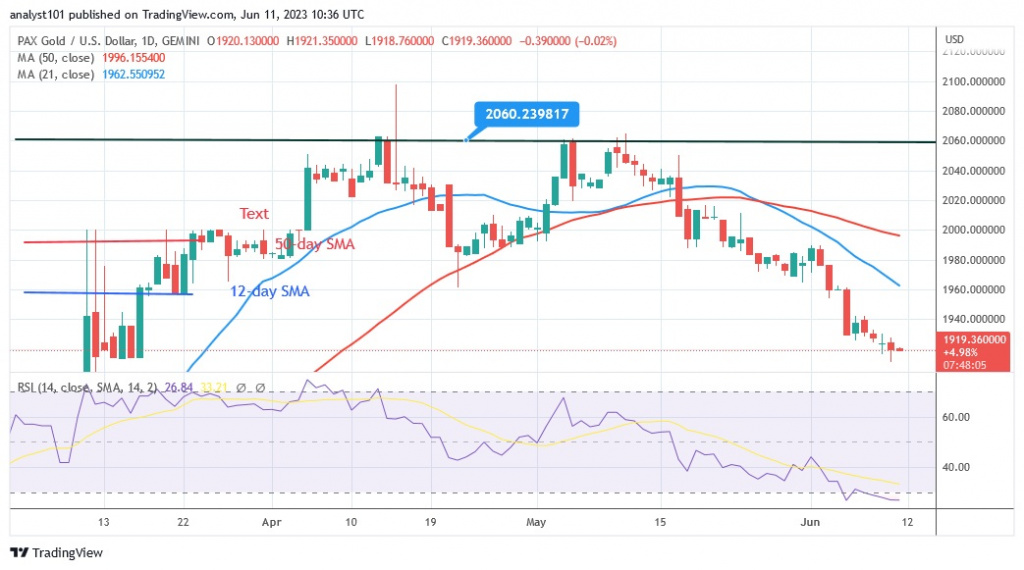
The price of PAX GOLD (PAXG) is falling below the moving average lines. The inability of buyers to maintain positive momentum above the $2,060 resistance has led to this decline. After two unsuccessful attempts to break the recent high, buyers were rebuffed twice. PAXG recorded highs and lows today of $2,060 and $1,927, respectively. The oversold area of the market was reached by the current decline. Once the market approaches the oversold area, selling pressure should ease. On the upside, PAXG will regain upward momentum if the altcoin rises back above the moving average lines or breaks the resistance at $2,000. The altcoin is at level 26 of the Relative Strength Index for period 14. The altcoin is the third best performing cryptocurrency and has the following characteristics:
Current price: $1,942.48
Market capitalization: $496,265,739
Trading volume: $496M
7-day gain/loss: 1.41%
UNUS SED LEO
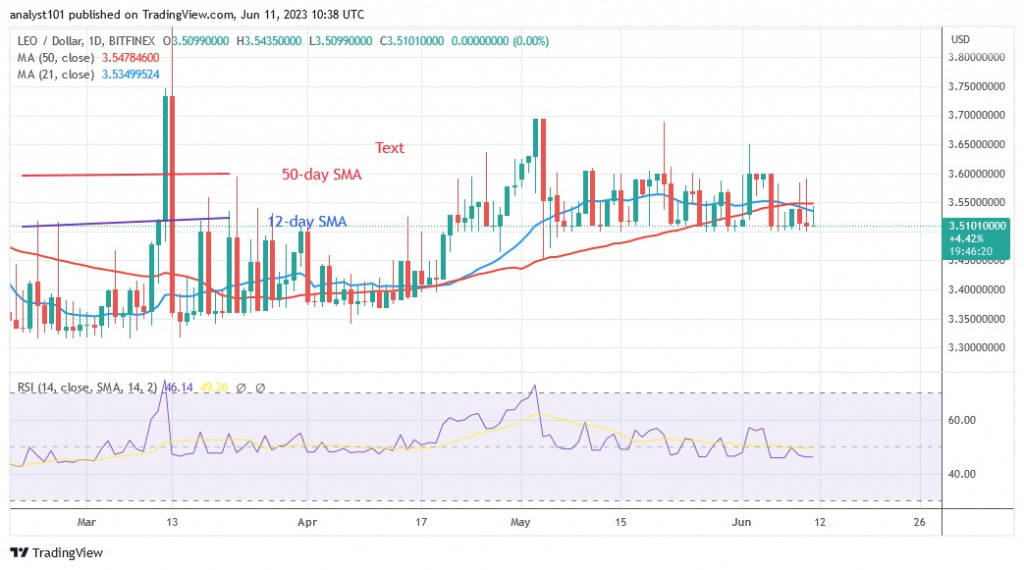
UNUS SED LEO (LEO) is in a sideways movement below the moving average lines. On May 3, LEO reached a high of $3.70 but was pushed back when the market reached the overbought zone. LEO is currently in a narrow range between $3.50 and $3.60 price levels. The price movement is stagnant due to the presence of Doji candlesticks. On the upside, the upward movement is slowed down by the resistance at $3.70. On the downside, the altcoin is able to decline as it is in the downtrend zone. The altcoin is at level 51 of the Relative Strength Index for period 14, which means that LEO has reached the equilibrium price level. That is, supply and demand are balanced. The fourth best cryptocurrency is LEO. Its attributes include the following:
Current price: $3.53
Market capitalization: $3,480,911,773
Trading volume: $720,249
7-day gain/loss: 2.68%
Maker
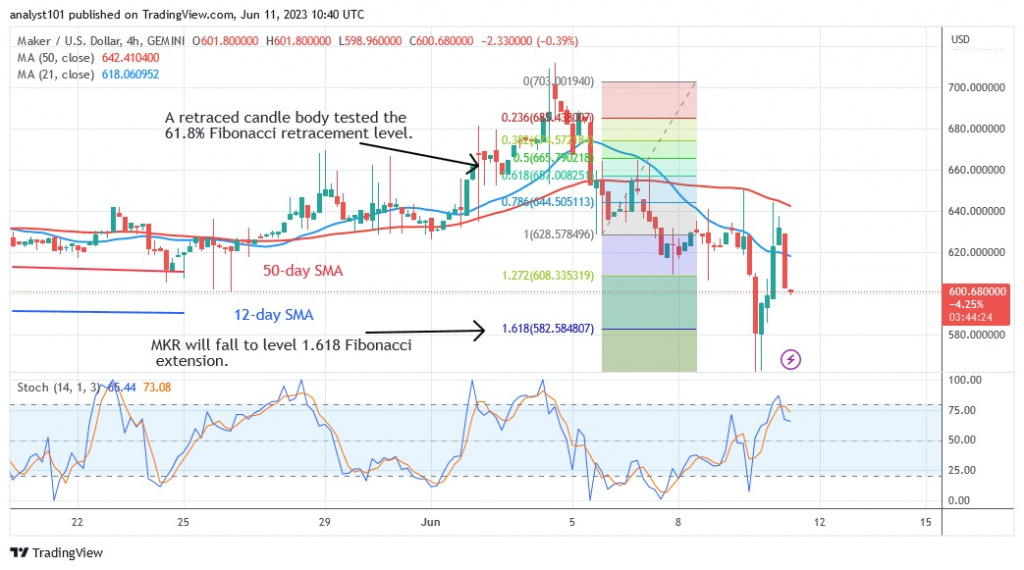
The price of Maker (MKR) is falling below the moving average lines. The value of the cryptocurrency asset has declined since June 4. MKR is now trading at $603 as of press time. MKR made an upside correction after the June 6 decline and a candlestick tested the 61.8% Fibonacci retracement line. After the correction, MKR will fall to the level of 1.618 Fibonacci extension or $582.58. According to the price movement, the altcoin has declined after testing the 1.618 Fibonacci extension. Below level 80 of the daily stochastic, altcoin is currently experiencing bearish momentum. The altcoin has the following characteristics and is now the fifth best-performing cryptocurrency:
Current price: $603.31
Market capitalization: $606,617.78
Trading volume: $39M
7-day gain/loss: 6.65%
Disclaimer. This analysis and forecast are the personal opinions of the author and are not a recommendation to buy or sell cryptocurrency and should not be viewed as an endorsement by CoinIdol. Readers should do their research before investing in funds.
Price
Price
Price
Price
News

(0 comments)