Altcoins Buy Dip as the Markets Reach the Oversold Regions

The altcoins below are all in bear markets. The coins are either oversold or at the bottom of the chart. It is anticipated that the emergence of bulls is expected in the oversold region.
XTZ/USD Major Trend: Bearish
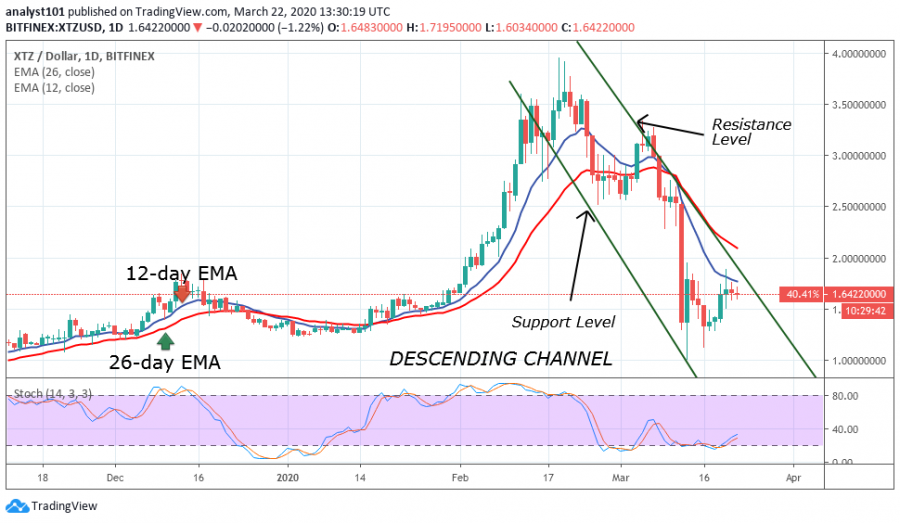
Tezos is in a bear market as it fell to a low of $1.29. In retrospect, Tezos has been in a sideways trend since April 2019. On January 16, the bulls bought at the low of $1.29 as XTZ resumed an upward move. The bulls took the price to a high of $3.50 but were resisted. This overhead resistance remains unbroken after three attempts by the bulls. The market embarked on a downward move. The initial fall was to the low of $2.50, and then a correction was made to the high of $3.23. XTZ made a final downward move to the low of $1.29. At the moment, the market is consolidating above $1.29 support level. Tezos may resume an uptrend if the price breaks the resistance level and closes above it. Presently, XTZ is above the 25% range of the daily stochastic. It indicates that Tezos is in a bullish moment.
LINK/USD Major Trend: Bearish
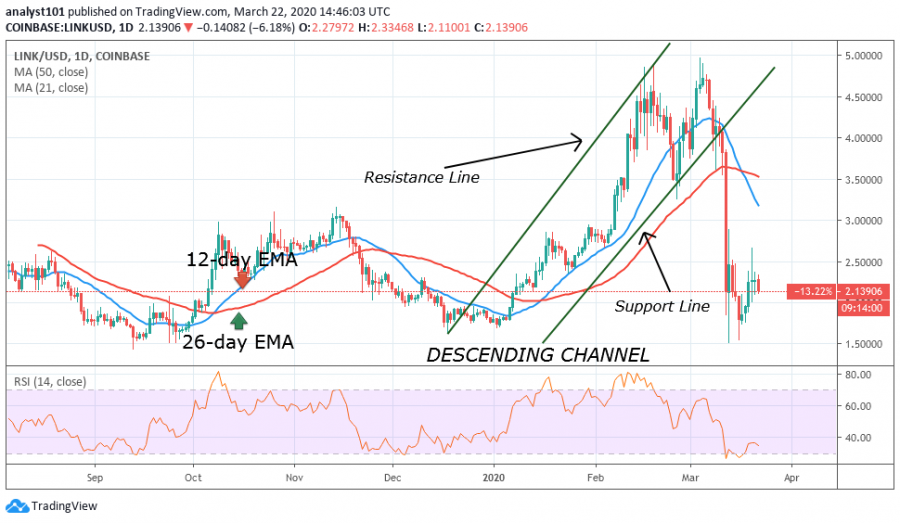
LINK is in a bear market as the price falls to a low of $1.50.
The bears succeeded in erasing the earlier bull market. In the price action of October and November 2019, the market formed a bearish triple top pattern at a high of $3.0. This resulted in a downward move to a low of $1.75. Subsequently, the bulls bought at this low as the market commenced an upward move. The bull market reached a high of $4.50 but pulled back to the low of $3.50. The second uptrend reached a high of $5.0. Unfortunately, the bulls were resisted and the market has a sharp drop to the low of $1.50. Nonetheless, the market is consolidating at the bottom of the chart.
HT/USD Major Trend: Bearish
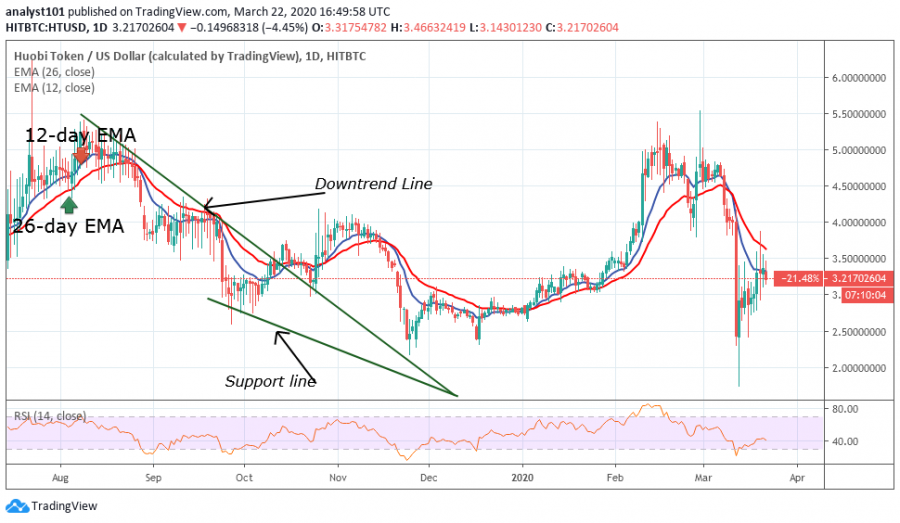
Huobi token is trading in a bear market. The HT coin has traded in all the markets. In February, HT reached a high of $5 but encountered selling pressure. The bulls made a retest at the overhead resistance which resulted in the downward movement of the coin. HT dropped to a low of $2.50. The support at $2.50 is holding as the bulls resumed another upward move. The Relative Strength Index has risen level 45 but it is below the centerline 50. HT is rising but still in the downtrend zone.
ETC/USD Major Trend: Bearish
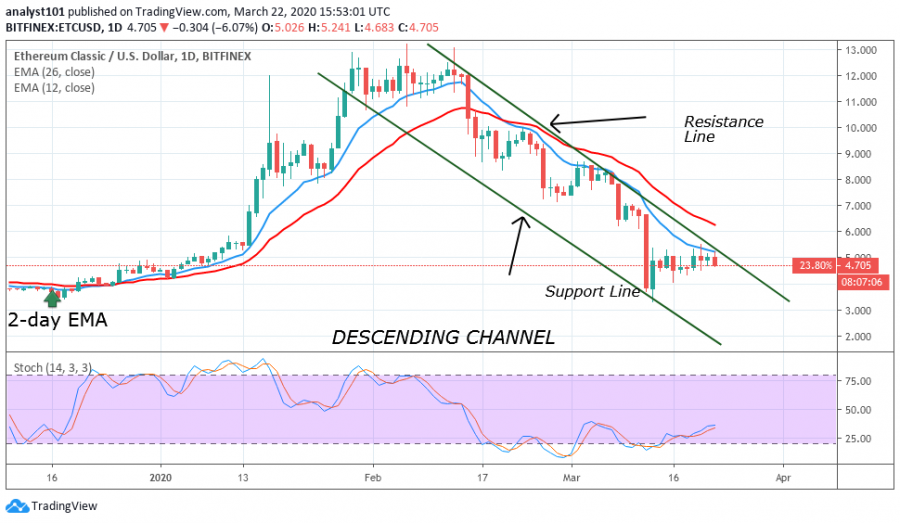
Ethereum Classic has been in a sideways trend since July 2019. Nonetheless, on January 14, the bulls bought at a low of $5.47 as ETC was propelled into an upward move. The pair reached a high of $12 and started trading below the overhead resistance. The bulls failed to push the price above the overhead resistance as the coin resumed its downward move. ETC was making a series of lower highs and lower lows to the low of $4. However, if the price breaks the resistance line and closes above it, the upward move will resume. ETC is above the 25% range of the daily stochastic. It indicates that the pair is in bullish momentum.
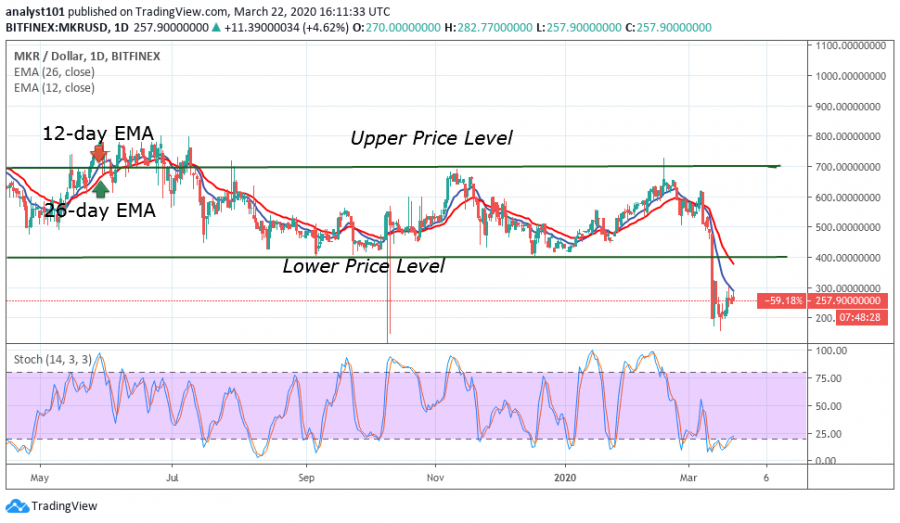
MKR/USD Major Trend: Ranging
Maker has been in a sideways trend since 2019. The pair has been fluctuating between the level of $400 and $700. The range-bound levels have remained intact since last year. Neither the bulls nor the bears have broken these key levels Nonetheless, recently, the bears broke the lower price level and the coin fell to the low of $200. Meanwhile, MKR has fallen below the 20% range of the daily stochastic indicating that Maker is in the oversold region. Buyers are expected to push MKR upward.
Disclaimer. This analysis and forecast are the personal opinions of the author that are not a recommendation to buy or sell cryptocurrency and should not be viewed as an endorsement by CoinIdol. Readers should do their own research before investing funds.
Price
Price
Price
Price
Price

(0 comments)