Cardano Recovers Above $0.30 And Starts Its Bullish Uptrend

Cardano's (ADA) price decline reached a bearish exhaustion on August 5 with a low of $0.27. Price analysis by Coinidol.com.
ADA price long-term forecast: bearish
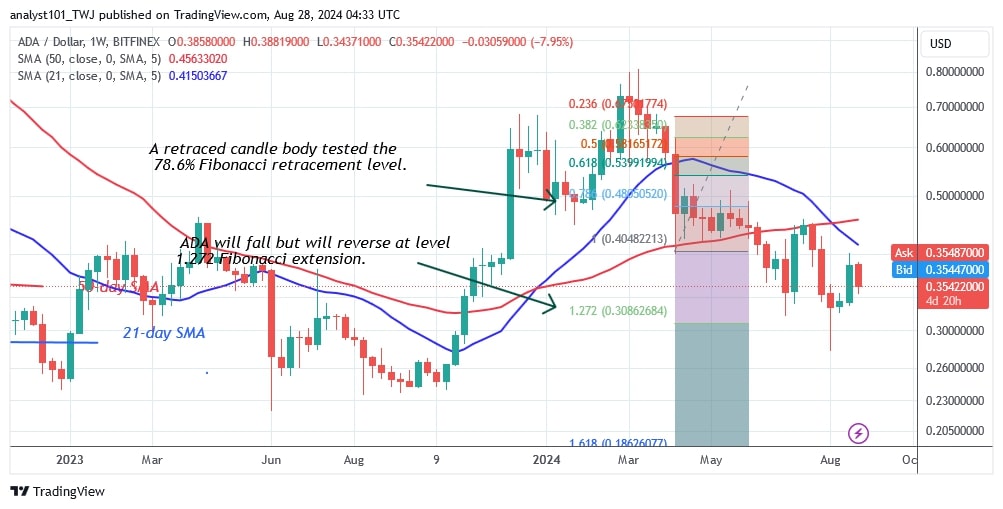
The price indicator previously predicted that ADA would fall but then reverse at the 1.272 Fibonacci extension level or $0.308. The price of the cryptocurrency surpassed the Fibonacci extension before falling back. The upward correction has failed to break the moving average lines or the barrier at $0.40.
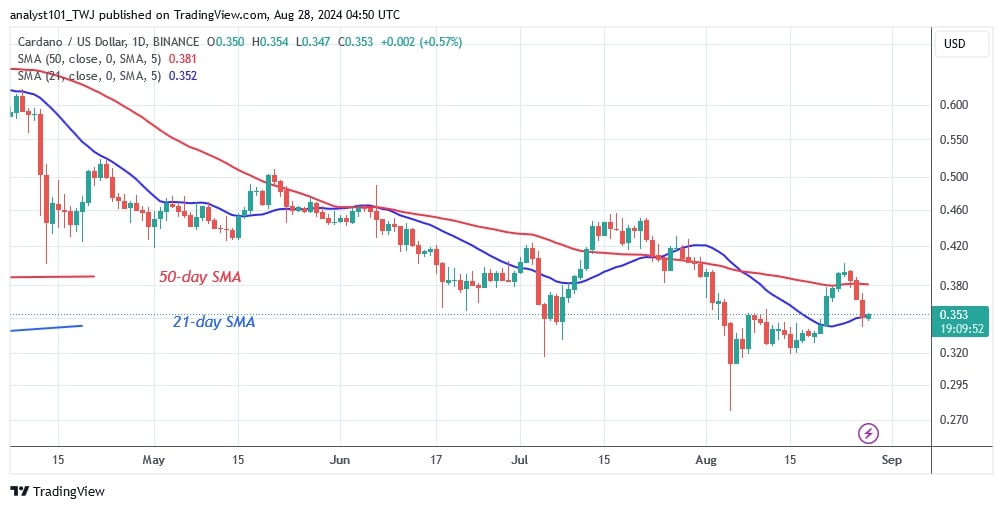
Cardano has pulled back between the moving average lines since it reached resistance at $0.40. The selling pressure has eased and the altcoin has started a sideways movement above the $0.30 support but below the $0.40 resistance.
Cardano is currently trapped between the moving average lines. Cardano is expected to reach a high of $0.46 if the bulls break above the 50-day SMA and resistance at $0.40. Cardano is currently worth $0.35. If the bullish scenario fails, the sideways trend could continue.
ADA indicator analysis
The daily chart shows that Cardano is trading above the 21-day SMA support but below the 50-day SMA resistance. The price of the cryptocurrency has fallen above the 21-day SMA as it resumes its uptrend. The altcoin will perform if the moving average lines are broken.
Technical Indicators
Key Resistance Zones: $0.80, $0.85, and $0.90
Key Support Zones: $0.50, $0.45, and $0.40

What is the next move for ADA?
Cardano started a sideways movement after the end of the bearish momentum on August 5. The altcoin's price range is between $0.30 and $0.40. The ADA price is bearish and is approaching its previous low of $0.31. The range-bound movement will continue if the altcoin retraces and finds support above the $0.30 level.

Disclaimer. This analysis and forecast are the personal opinions of the author. They are not a recommendation to buy or sell cryptocurrency and should not be viewed as an endorsement by CoinIdol.com. Readers should do their research before investing in funds.
News
Price
News
Price
Price

(0 comments)