Ripple Price Rebounds, Resumes Fresh Uptrend, Faces Initial Resistance at the $0.58 High

Following the breakdown and subsequent correction, Ripple (XRP) has been on a downward move. The price was making a series of lower highs and lower lows.
Ripple (XRP) Price Long-Term Forecast: Bullish
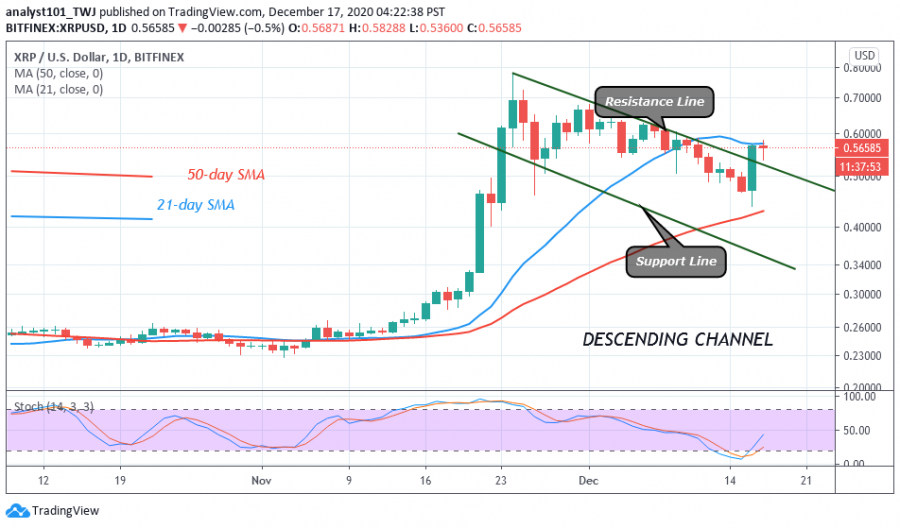
In December, sellers pushed the Ripple price to $0.436 low while the bulls bought the dips as the altcoin rebounded to reach the $0.58 high.
Since December 16, buyers could not penetrate the recent high as the candlesticks show long wicks pointing upward. These candlesticks, in the lower time frame, indicate that there is strong selling pressure at the higher price level.
Today, a candlestick with a long tail is pointing downward above the $0.54 support level. Ripple’s price movement is facing restrictions at the recent high and the current support. This implies that the coin is likely to fluctuate between $0.54 and $0.58 for a couple of days. Meanwhile, the upward move will resume once the $0.58 resistance is breached.
Ripple (XRP) Indicator Analysis
The price has broken the resistance line of the ascending channel. The implication is that the bearish trend has been terminated. A fresh upward move has resumed.
Now has bullish momentum.

Key Resistance Zones: $0.70, $0.75, $0.80
Key Support Zones: $0.30, $0.25, $0.20
What Is the Next Move for Ripple (XRP)?
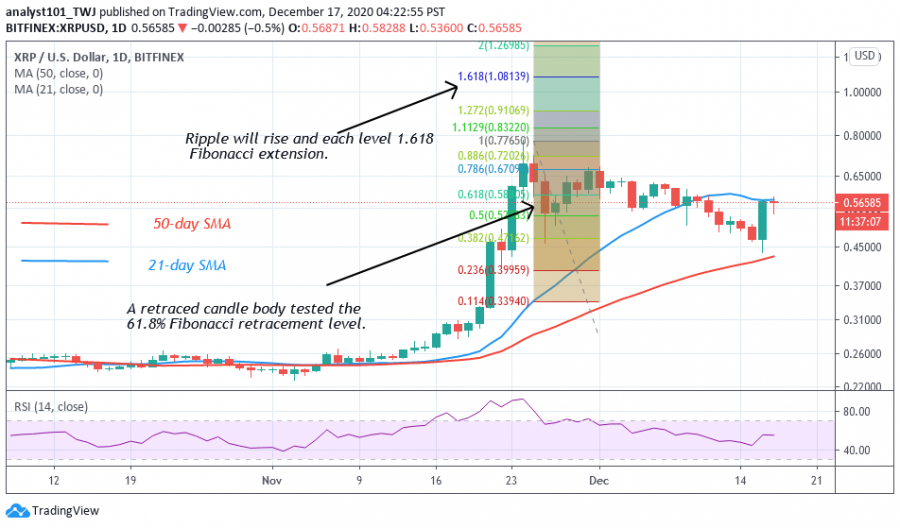
The coin has rebounded above $0.436 after the recent breakdown. The Fibonacci tool has indicated an upward of the coin. On November 24 uptrend; a retraced candle body tested the 61.8% Fibonacci retracement level. The retracement implies that Ripple will rise and reach level 1.618 Fibonacci extension or the high of $1.081.

Disclaimer. This analysis and forecast are the personal opinions of the author and not a recommendation to buy or sell cryptocurrency and should not be viewed as an endorsement by CoinIdol. Readers should do their own research before investing funds.
Price
Price
Price
Price
Price

(0 comments)