TRON Remains In A Sideways Trend And Again Tests The Barrier At $0.115
Updated: Jan 24, 2024 at 14:28

TRON (TRX) price has been holding above the moving average lines in a sideways trend.
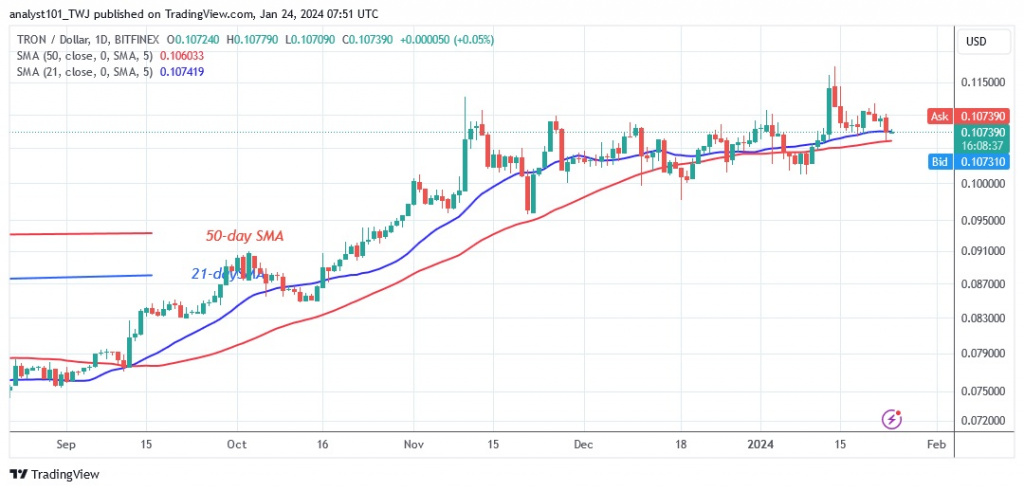
TRON price long term forecast: in the range
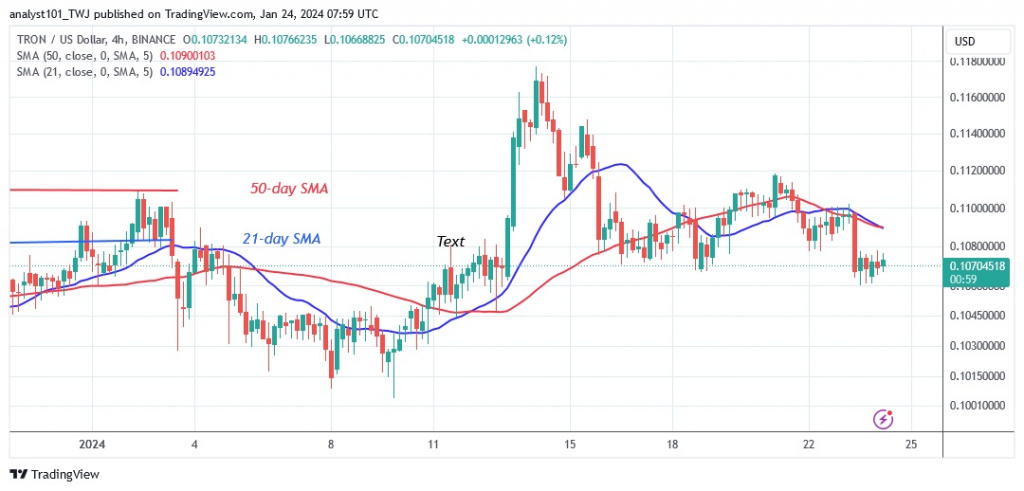
Since November 10, 2023, the sideways movement has remained constant between $0.10 and $0.115. Neither the bulls nor the bears have broken through the range. Since January 14, 2024, TRON has been in a downtrend after being rejected at the overhead resistance. Today, altcoin broke above the 21-day SMA or low at $0.107. The sideways trend will continue upwards if the existing support holds. The altcoin will rise again to retest or break through the $0.115 resistance. TRON will return to the lower price area if the bears break the moving average lines. The altcoin will then drop to $0.10. In the meantime, TRON is currently worth $0.107.
TRON indicator reading
TRON's price bars are sliding below and above the moving average lines, which is consistent with the sideways pattern. The price action is characterized by doji candlesticks. The doji candlesticks have limited the price movement within the current price range.

Key supply zones: $0.09, $0.10, $0.11
Key demand zones: $0.06, $0.05, $0.04
What is the next direction for TRON?
TRON is trading sideways but has slipped into the middle of its price range. The altcoin is dipping and finding support above the 21-day SMA, indicating an uptrend. The altcoin will rise if the price bars remain above the moving average lines and retest the overhead resistance level.

Disclaimer. This analysis and forecast are the personal opinions of the author and are not a recommendation to buy or sell cryptocurrency and should not be viewed as an endorsement by CoinIdol.com. Readers should do the research before investing in funds.
News
Price
Price
News
Price

(0 comments)