Solana Holds Above $130 And Reaches Overbought Status
Updated: Mar 06, 2024 at 11:14

The price of Solana (SOL) has regained its positive momentum and has risen above the 21-day SMA to resume its uptrend. Price analysis by Coinidol.com.
Long-term forecast for Solana price: bearish
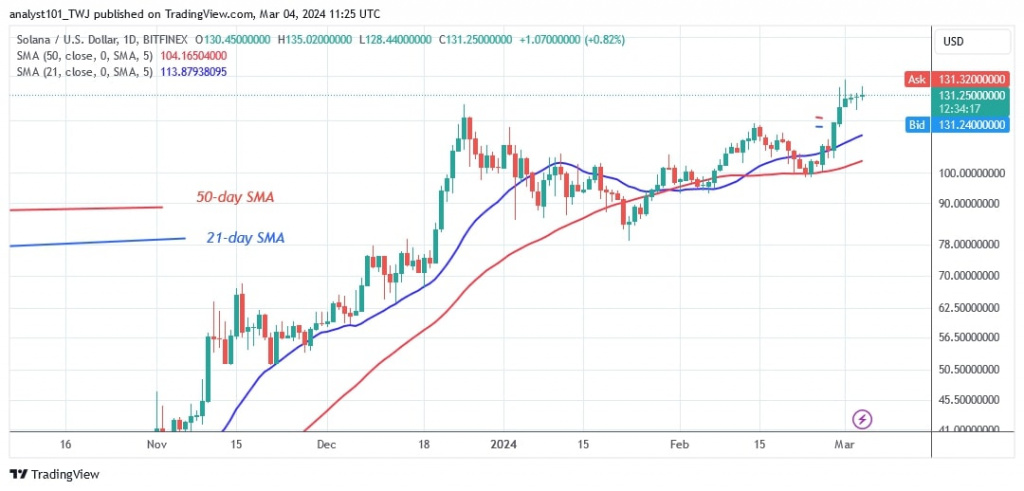
The altcoin was previously trapped between the moving average lines, with the bulls defending the slide above the 50-day SMA. Solana has been in a sideways trend since December 25, 2023, after the uptrend ended at $126. The bulls broke the sideways trend and overcame the resistance at $126. Bullish momentum has reached a high of $137.
On the upside, the altcoin is again testing the $138 level. If the current resistance is broken, the altcoin will reach its previous high of $157. If buyers fail to break through the current high, the altcoin will be forced to trade sideways. On the downside, the altcoin will fall if the bears break the current support level at $126.
Analysis of the Solana price indicator
The price bars are higher than the moving average lines, which are sloping horizontally despite the uptrend. The price movement has been halted by the presence of doji candlesticks. The altcoin is also in the overbought zone of the market.
Technical indicators
Key supply zones: $100, $120, $140
Key demand zones: $80, $60, $40

What is the next development for Solana?
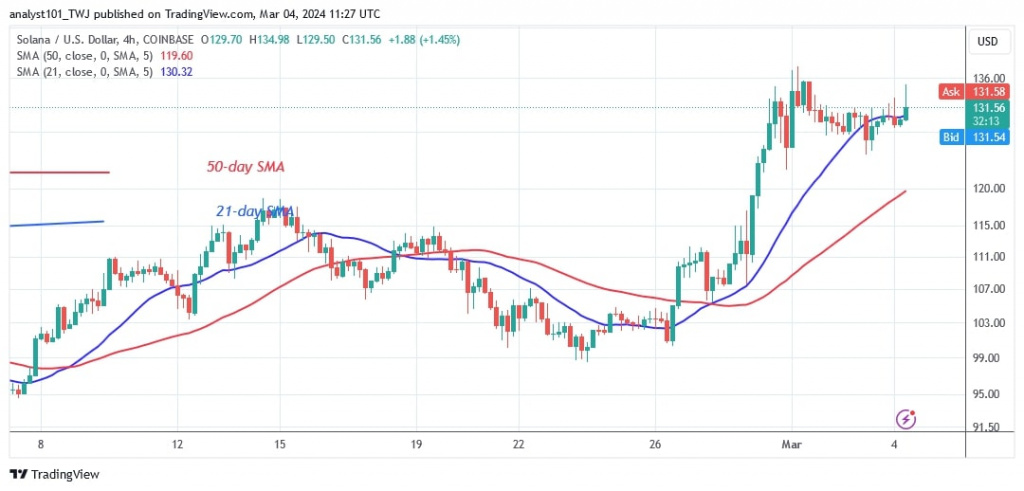
On the 4-hour chart, Solana is forced to trade sideways below the $138 level. The altcoin has been trading between $126 and $138. Solana will resume its uptrend once the $138 resistance is broken. However, the altcoin's uptrend is uncertain as it enters the overbought territory.

Disclaimer. This analysis and forecast are the personal opinions of the author and are not a recommendation to buy or sell cryptocurrency and should not be viewed as an endorsement by CoinIdol.com. Readers should do their research before investing in funds.
Price
News
Price
Price
Price

(0 comments)