Ripple Retraces to $0.23 Low as Bulls Buy the Dips

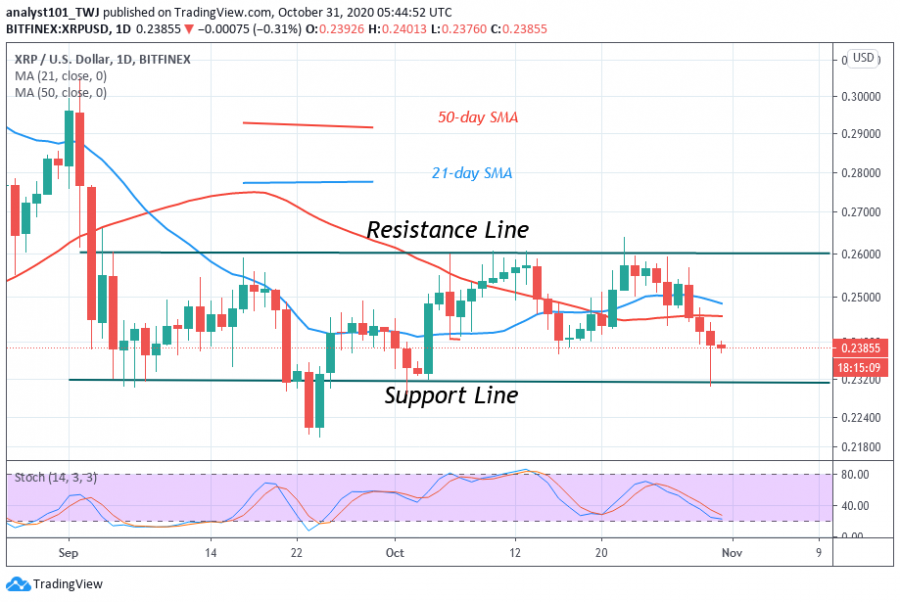
Since October 22, the Ripple downward move ended on October 30 with the formation of a candlestick with a long tail.
The long tail shows that there is strong buying pressure at the previous support level resisting the selling pressure. On October 30, sellers pushed the price to $0.230 low while buyers pushed XRP back to $0.238 high.
The bearish trend will continue on the downside if sellers are successful. The price will break the $0.23 support and bearish momentum will extend to the $0.22 low. On the other hand, if buyers push back price on the upside, the sideways move between $0.23 and $0.26 will resume. The bullish momentum will resurface as the price will attempt to retest the $0.26 resistance. A breakout at $0.26 will accelerate the price movement to a $0.30 high.
Ripple indicator analysis
Ripple has fallen below the 30% range of the daily stochastic. It indicates that the market is in a bearish momentum. The 21-day and 50-day SMAs are sloping horizontally indicating the sideways move.

Key Resistance Zones: $0.35, $0.40, $0.45
Key Support Zones: $0.25, $0.20, $0.15
What is the next move for Ripple?
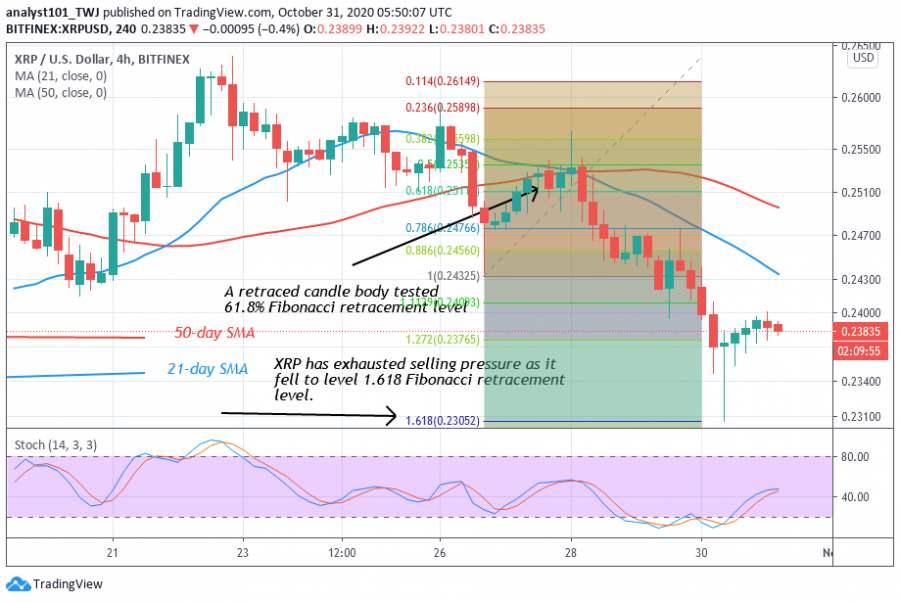
From the price action, XRP appears to reach bearish exhaustion as the price is corrected upward to a $0.24 high. In the meantime, On October 26 downtrend; the retraced candle body tested the 61.8% Fibonacci retracement level. This implies that XRP will decline to level 1.618 Fibonacci extensions or $0.2305 low. The coin has already tested this level and moved up.

Disclaimer. This analysis and forecast are the personal opinions of the author that are not a recommendation to buy or sell cryptocurrency and should not be viewed as an endorsement by CoinIdol. Readers should do their own research before investing funds.
Price
Price
Price
Price
Price

(0 comments)