Ripple Consolidates Above $1.35 Support as Sellers Push to the Downside
Updated: May 11, 2021 at 13:23

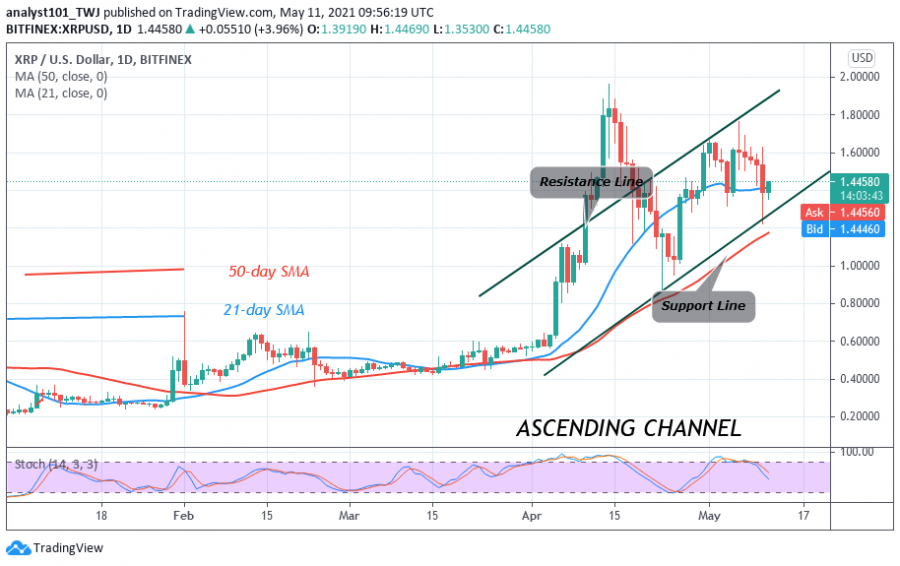
Today, Ripple rebounded above $1.37 support as the altcoin resumed a fresh uptrend. The market has risen to a $1.45 high at the time of writing.
Before the rebound and subsequent upward move, XRP has been falling since May 6. On May 6, Ripple was resisted at the high of $1.76 as the altcoin declined to $1.22 low. The bulls bought the dips and catapulted XRP to resume an upward move.
In the previous price action on May 4, the altcoin fell to the low of $1.34 and rebounded above the current support. The bullish momentum reached a high of $1.76. Similarly, the current price is likely to rise to retest or break the resistance at $1.76. Nevertheless, if the resistance at $1.76 is breached, the bullish momentum is likely to retest the $1.96 overhead resistance. XRP/USD will resume the second round of uptrend if the bulls break the $1.96 overhead resistance.
Ripple indicator analysis
Ripple is below 80% range of the daily stochastic. It indicates that the XRP is in bearish momentum. Sellers have emerged to push prices down. XRP price is above the 21-day and the 50-day SMA. Presently a bullish candlestick is above the 21-day SMA support. It indicates a possible upward movement of prices.

Technical indicators:
Major Resistance Levels – $1.95 and $2.0
Major Support Levels – $0.60 and $0.55
What is the next move for Ripple?
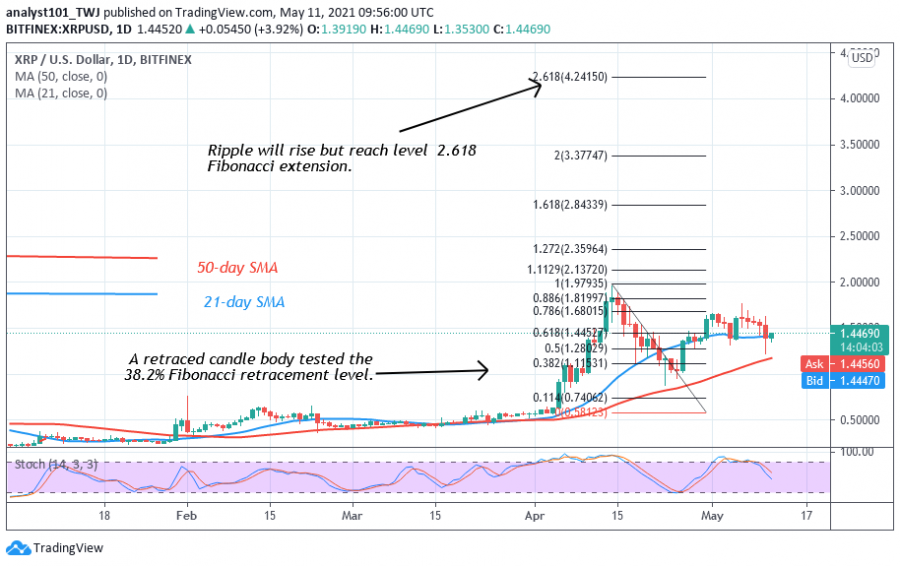
Ripple has resumed an upward move after the recent retracement. The altcoin is rising above the 21-day support. The Fibonacci tool analysis has remained the same as the altcoin trades marginally. Meanwhile, on April 14 uptrend; a retraced candle body tested the 38.2% Fibonacci retracement level. The retracement indicates that Ripple is likely to rise to level 2.618 Fibonacci extension or the high of $4.24. From the price action, XRP is trading at $1.44 at the time of writing.

Disclaimer. This analysis and forecast are the personal opinions of the author and not a recommendation to buy or sell cryptocurrency and should not be viewed as an endorsement by CoinIdol. Readers should do their own research before investing.
Price
News
Price
Price
Price

(0 comments)