Ripple Bulls Overwhelm By Bears As The Altcoin Struggles Above $1.20 Support

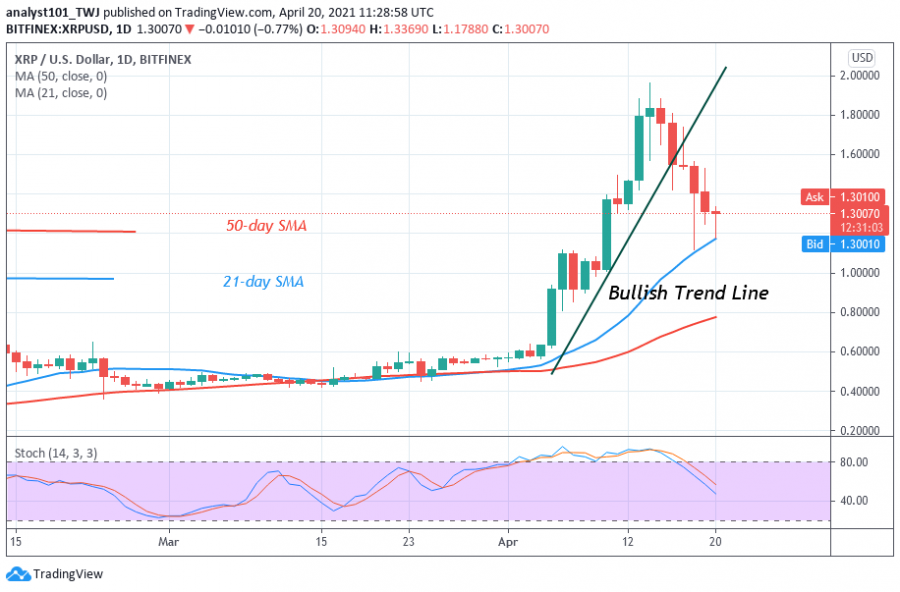
For the past week, Ripple has been in a downward move. The altcoin slumped from the high of $1.96 to a low of $1.20. XRP price slumps to the support of the 21-day SMA. If the 21-day SMA support holds, it is an indication of Ripple’s readiness to resume a fresh uptrend.
Today, XRP is hovering above the $1.20 support level. The bears have retested the support level twice to break below it but without success. There are bullish signals above the current support which indicates the presence of buyers. However, if the bears break the current support, the market will decline to $1.00 or $0.60 low. On the other hand, XRP will revisit the previous highs if the current support holds. XRP/USD is trading at $1.29 at the time of writing.
Ripple indicator analysis
XRP price is above the moving averages which indicate a possible rise in price. XRP is below the 80% range of the daily stochastic. This indicates that the market is in a bearish momentum. XRP price has broken below the bullish trend line. The implication is that the uptrend may be terminated if the bulls fail to recover above the trend line.

Technical indicators:
Major Resistance Levels – $1.95 and $2.0
Major Support Levels – $0.60 and $0.55
What is the next move for Ripple?
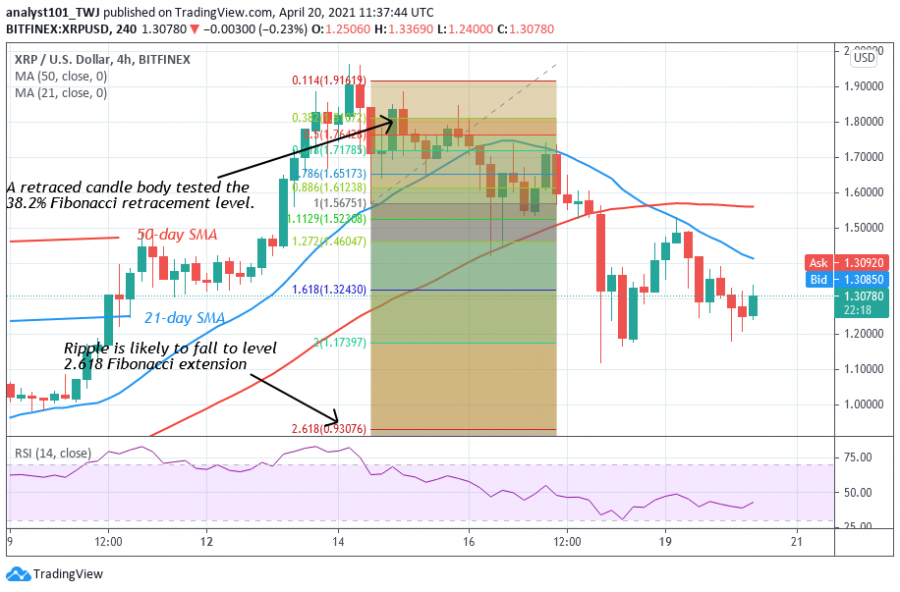
XRP is in a downward move as price hovers above $1.20 support. Buyers and sellers are in price struggle between levels $1.20 and $1.50. Meanwhile, on April 14 downtrend; a retraced candle body tested the 38.2% Fibonacci retracement level. This retracement gives the impression that XRP will fall to level 2.618 Fibonacci extensions or the low of $0.92.

Disclaimer. This analysis and forecast are the personal opinions of the author are not a recommendation to buy or sell cryptocurrency and should not be viewed as an endorsement by CoinIdol. Readers should do their own research before investing.
Price
Price
Price
Price
Price

(0 comments)