Ethereum Recovers but Traps at the Resistance of $156

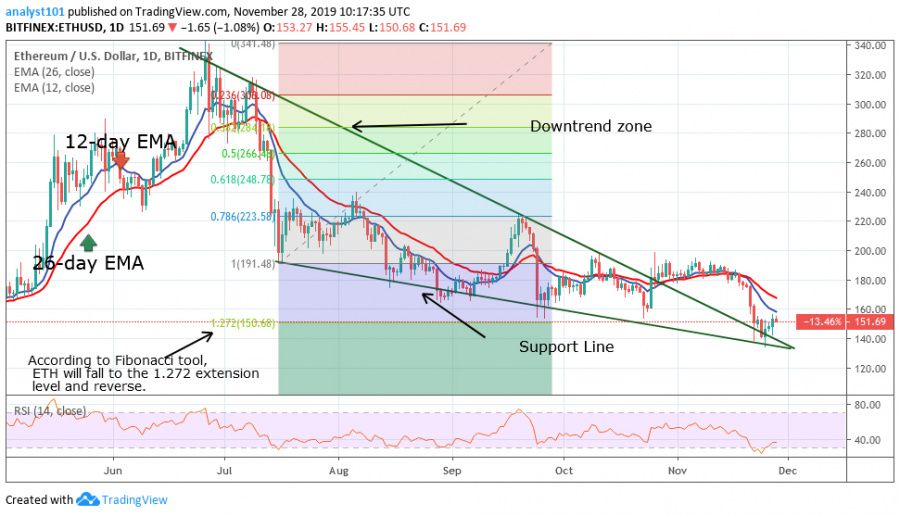
Ethereum was facing selling pressure a few days ago, as the bears broke through the support at $150. Today, the coin is moving up from its current low at $135. The price rise is said to be hampered at the resistance of $156. This was the price level that has provided support for over two months is now resistance to the coin.
Ethereum is still in the bearish trend zone and it is currently facing resistance at the current price level. Nevertheless, if the price upward move is sustained and the bulls break the resistance level, ETH will rise and continue its uptrend. Conversely, if the current resistance becomes a threat and the coin falls and breaks the low of $135, ETH will find another low at $120.
Ethereum Indicator Analysis
From the daily chart, the market is below the 12-day and 26-day EMAs; this suggests that the price is likely to fall. The RSI level 37, explains that price is coming out of the oversold region. The 1.272 Fibonacci extension level is where the price will fall and reverse.

Key Supply Zones: $220, $240, $260
Key Demand zones: $160, $140, $120
What Is the Next Direction for Ethereum?
A downward fall is possible if the bulls fail to overcome the resistance at $156.
The current resistance may not be an easy task for the bulls. This same resistance provides support for over two months before it was eventually overcome. Ethereum should have more buyers at the current price for the market to move up. However, another selling will result in another low at $120.
Disclaimer. This analysis and forecast are the personal opinions of the author are not a recommendation to buy or sell cryptocurrency and should not be viewed as an endorsement by CoinIdol. Readers should do their own research before investing funds.
Price
Price
Price
News
Price

(0 comments)