Ethereum Regains Upside Momentum, Can the Bulls Resume the Rally?

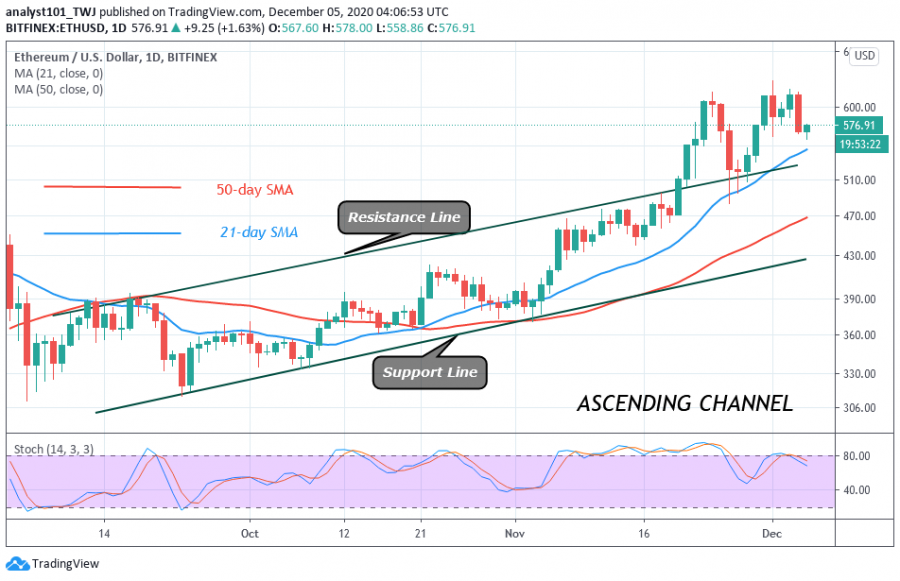
Since November 24, buyers have been able to sustain the upside range between $560 and $620. Recently, Ether retraced to the support at $565 and has resumed upward.
The recent sideways move near the overhead resistance is an indication of a possible breakout in the future. The bottom line is that as long as the price level is sustained above $560, the upside range will continue until a breakout is achieved.
Today, the altcoin resumed its upward move to retest the overhead resistance. Ethereum will resume a fresh uptrend if the overhead resistance is breached. The crypto will resume the upside momentum and rally to $800. However, in the absence of any breakout, the sideways move below the resistance will continue. Nonetheless, the upside momentum will be weakened, if the coin falls and the price breaks the $550 support
Ethereum indicator analysis
The biggest altcoin is below the 80% range of the daily stochastic. This indicates that the coin has bearish momentum. The coin has been falling after the rejection on December 1. The uptrend will continue as long as the price bars are above the SMAs. A break below the SMAs will mean a downward movement of the coin.

Key Resistance Zones: $440, $460, $480
Key Support Zones: $160, $140, $120
What is the next direction for Ethereum?
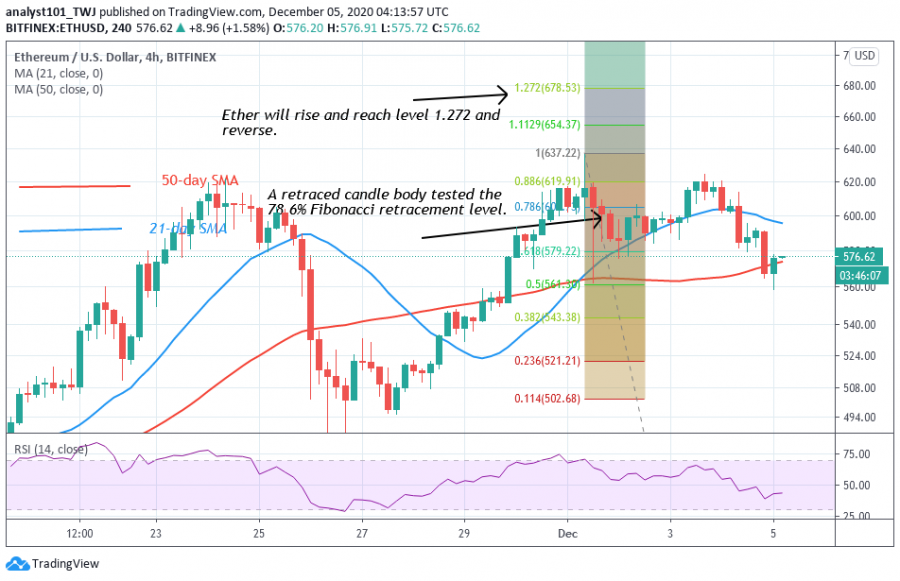
The Fibonacci tool has indicated a possible move after the rejection on December 1. On December 1 uptrend, a retraced candle body tested the 78.6 % Fibonacci retracement level. The retracement indicates that ETH will rise and reach level 1.272 Fibonacci extensions. That is the high of $678.53 but will reverse to level 78.6 % Fibonacci retracement where it originated.

Disclaimer. This analysis and forecast are the personal opinions of the author that are not a recommendation to buy or sell cryptocurrency and should not be viewed as an endorsement by CoinIdol. Readers should do their research before investing funds.
Price
Price
Price
Price
Price

(0 comments)