Ethereum Classic Trades Marginally, Consolidates in a Tight Range between $9 and $13
Updated: Mar 13, 2021 at 10:05

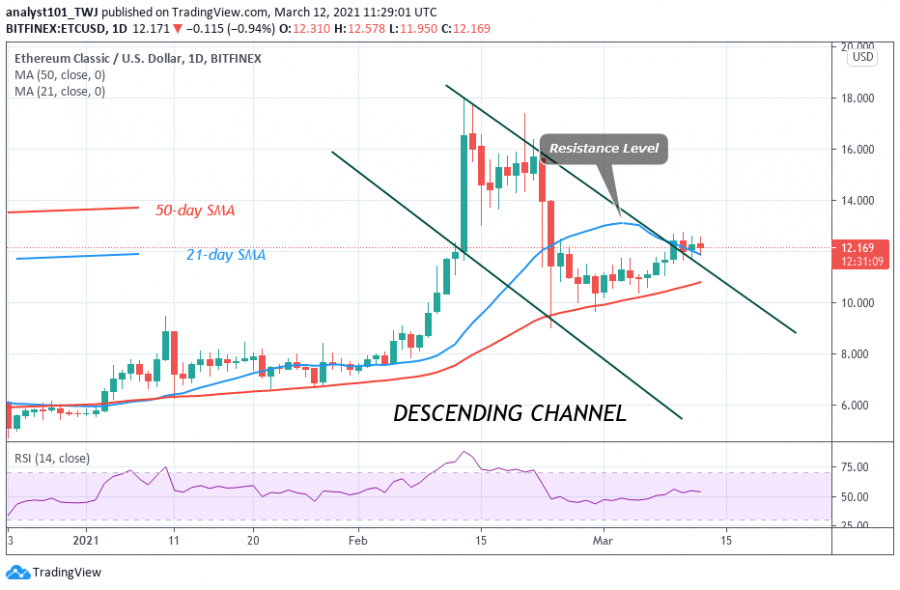
Ethereum Classic is in a downward correction soon after the breakdown on February 23. Today, ETC is trading at $12.09 at the time of writing. After the breakdown, the altcoin dropped to $9.03 low and made a pullback.
ETC price corrected upward to $12 and resumed a range-bound move between $9 and $13. The altcoin has been trading marginally. Since March 9, the price movement has been stagnant above $12. On the upside, if the bulls can push the price above the $13 resistance, the uptrend will resume. However, if the bears break the $9 support, ETH will sink on the downside.
Daily chart indicators reading
ETC price is above the 21-day and 50-day SMAs which indicates a possible rise in price. The price is at level 53 of the Relative Strength Index period 14. The market is in the uptrend zone and above the centerline 50. ETC has room to rally on the upside.

Technical indicators:
Major Resistance Levels – $20 and $22
Major Support Levels – $11 and $9
General outlook for Ethereum Classic
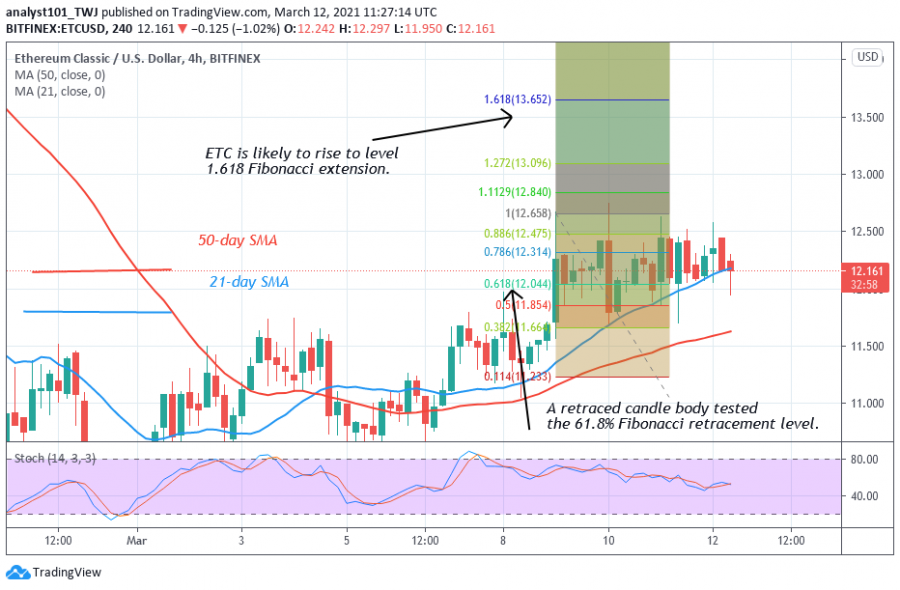
The ETC/USD has a chance of resuming upward if the recent high is breached. On March 9 uptrend; a retraced candle body tested the 61.8% Fibonacci retracement level. The retracement indicates that ETC will rise to level 1.618 Fibonacci extension or the high of $13.65.

Disclaimer. This analysis and forecast are the personal opinions of the author that are not a recommendation to buy or sell cryptocurrency and should not be viewed as an endorsement by Coin Idol. Readers should do their own research before investing funds.
News
News
Coin expert

(0 comments)