Polkadot Plunges to $16 Low, Pulls Back to Resume Correction
Updated: May 22, 2021 at 09:03

Following an impressive bullish run to the high $48, Polkadot (DOT) plunged to $16 low. The bulls bought the dips as the price corrected upward.
Polkadot (DOT) Price Long-Term Analysis: Bullish
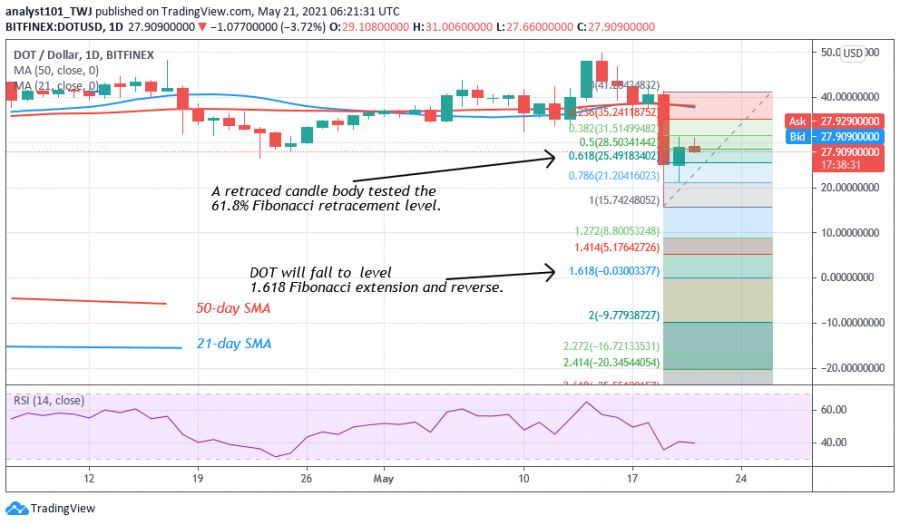
The uptrend was terminated at a high of $32. But as bulls fail to sustain DOT price above $32 high, the altcoin is likely to fall and revisit the previous low. At the previous low, the price action is characterized by candlesticks with long tails. The long candlestick tails suggest that there is strong buying pressure above $16 support.
On the downside, Polkadot is likely to retrace to the previous low.
Nonetheless, if the previous low holds, DOT price is likely to be range-bound between $16 and $32. In the meantime, the altcoin is retracing to the previous low at $16. If the current support holds, the altcoin is likely to be range-bound. However, the selling pressure will resume if the support is breached.
Polkadot (DOT) Indicator Analysis
DOT price has fallen to level 38 of the Relative Strength Index period 14. It indicates that the market is approaching the overbought region. The 21-day SMA and the 50-day SMA are sloping horizontally indicating the sideways move.

Technical indicators:
Major Resistance Levels – $48 and $52
Major Support Levels – $32 and $28
What Is the Next Direction for Polkadot (DOT)?
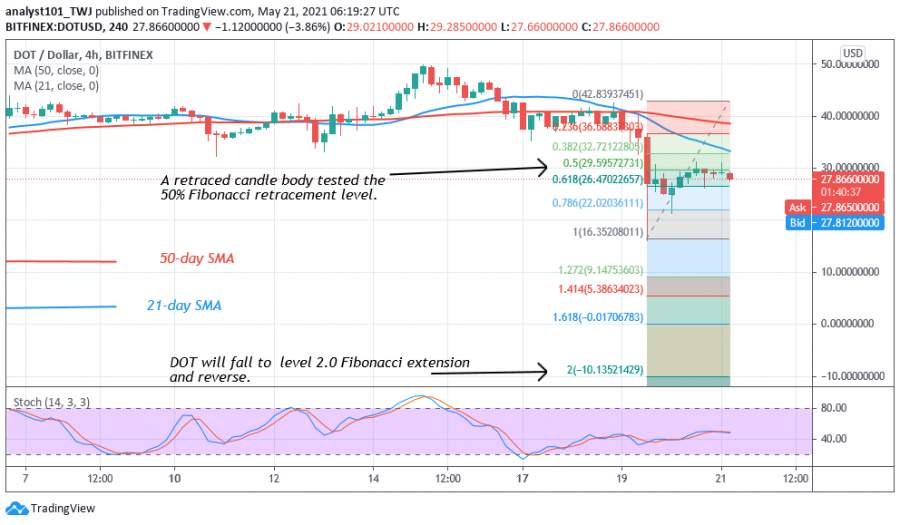
The altcoin has resumed downward after retesting the $32 high. Nevertheless, on May 19 downtrend; a retraced candle body tested the 50% Fibonacci retracement level. The retracement indicates that DOT will fall to level 2.0 Fibonacci extension. The altcoin is in a downward move to the previous low at $16.

Disclaimer. This analysis and forecast are the personal opinions of the author and are not a recommendation to buy or sell cryptocurrency and should not be viewed as an endorsement by CoinIdol. Readers should do their research before investing funds.
Price
News
Price
Price
Price

(0 comments)