Chainlink Faces another Rejection at $32 as Altcoin Remains Range Bound

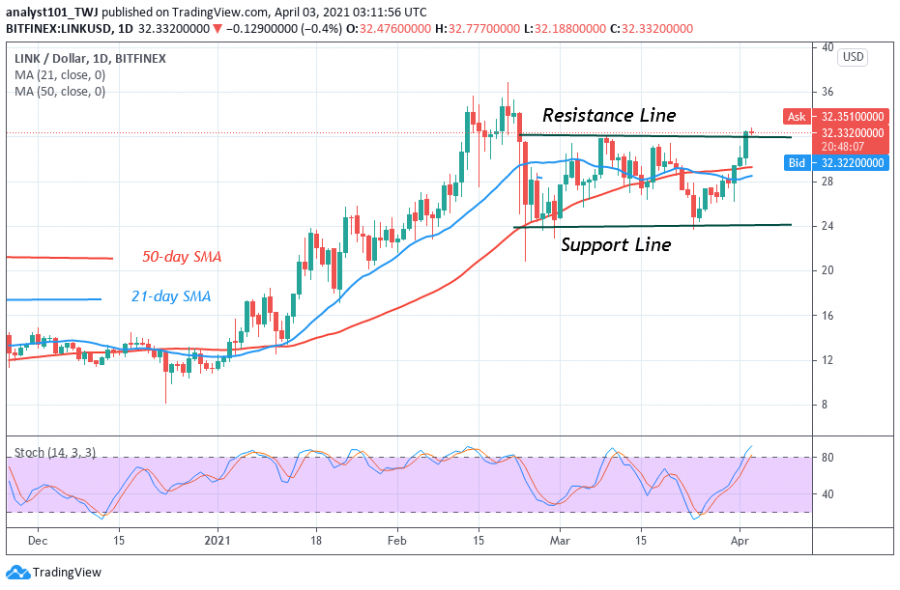
Chainlink's price is presently in a range-bound move. Following the testing of the lower price range, the bulls attempted to push the price above the overhead resistance.
However, there was strong selling pressure above the $32 high. Buyers' attempt to break the current range is unlikely as price reaches the overbought region of the market. Nevertheless, if the bulls have broken the resistance line, the altcoin would have reached a high of $36. Meanwhile, LINK is retracing after a recent price retest at $32. LINK price may fall below the moving averages which may increase further decline. LINK is trading at $31.89 at the time of writing.
Chainlink indicator reading
The 21-day and 50-day SMAs are sloping horizontally between February and March indicating the sideways trend. The price indicators are in the overbought region of the market. This explains that all price movements may reach bullish exhaustion.

Technical indicators:
Major Resistance Levels – $38 and $40
Major Support Levels – $22 and $20
What is the next move for Chainlink?
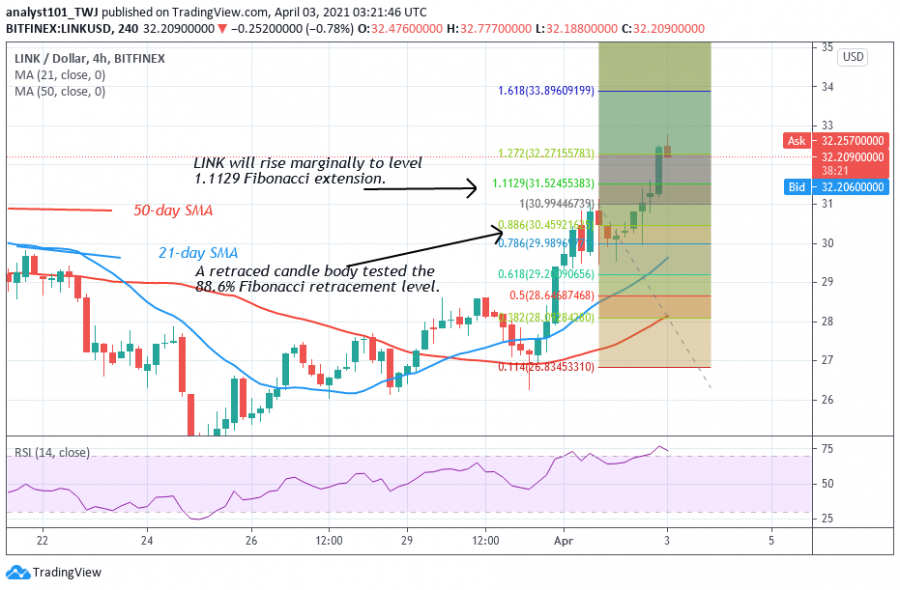
Chainlink's upward move is doubtful as the market reaches the overbought region. On April 1 uptrend; a retraced candle body tested the 88.6% Fibonacci retracement level. This retracement indicates that the market will rise to level 1.1129 Fibonacci extensions. That is the high of $31.52. From the price action, the LINK price has surpassed this level but it is presently falling.

Disclaimer. This analysis and forecast are the personal opinions of the author that are not a recommendation to buy or sell cryptocurrency and should not be viewed as an endorsement by Coin Idol. Readers should do their own research before investing funds.
Price
Price
Price
Price
Price

(0 comments)