Cardano May Face Further Selling After Rejection at $1.55
Updated: Apr 14, 2021 at 13:37

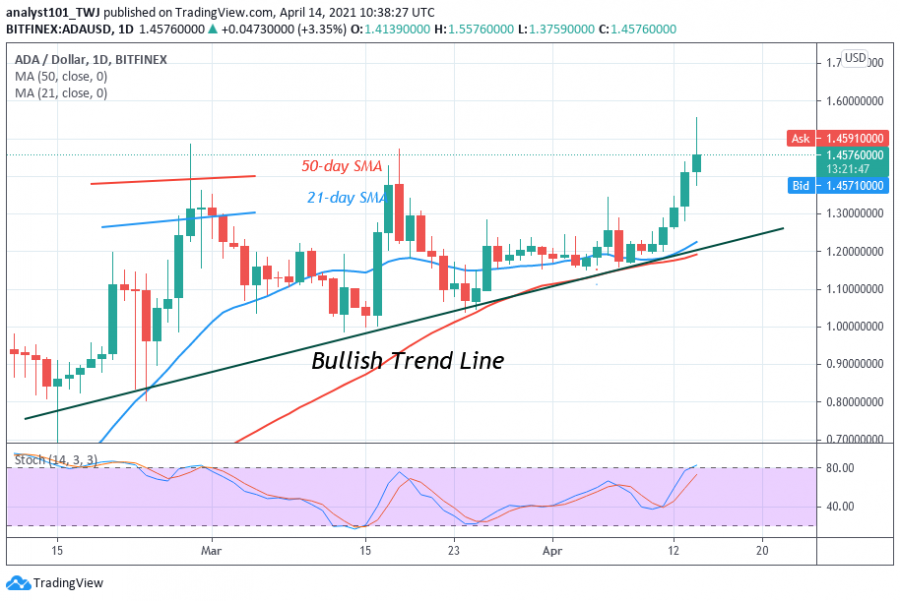
Today, Cardano rebounded above $1.45 support but the rally was stalled at a $1.55 high. Surprisingly, the altcoin dropped sharply to $1.37 low. The bulls buy the dips as the ADA rallies to a $1.50 high.
However, in today’s candlestick, the wick is pointing northward toward the $1.55 resistance zone. The candlestick indicates that there is strong selling pressure at the recent high. In other words, further selling is likely. Buyers have resumed a fresh uptrend to retest the $1.55 resistance level. On the upside, if buyers can sustain a price above $1.55, the uptrend will resume. However, the failure of buyers to sustain the price upward will compel price to drop to $1.40 low. ADA/USD is trading at $1.49 at the time of writing.
Cardano indicator analysis
ADA is below the 50% range of the daily stochastic but the stochastic bands are sloping upward. This is an indication of bullish momentum. ADA is at level 77 of the Relative Strength Index period 14. This indicates that an upward rally is doubtful as price reaches the overbought region.

Technical indicators:
Major Resistance Levels – $1.40 and $1.60
Major Support Levels – $0.80 and $0.60
What is the next move for Cardano?
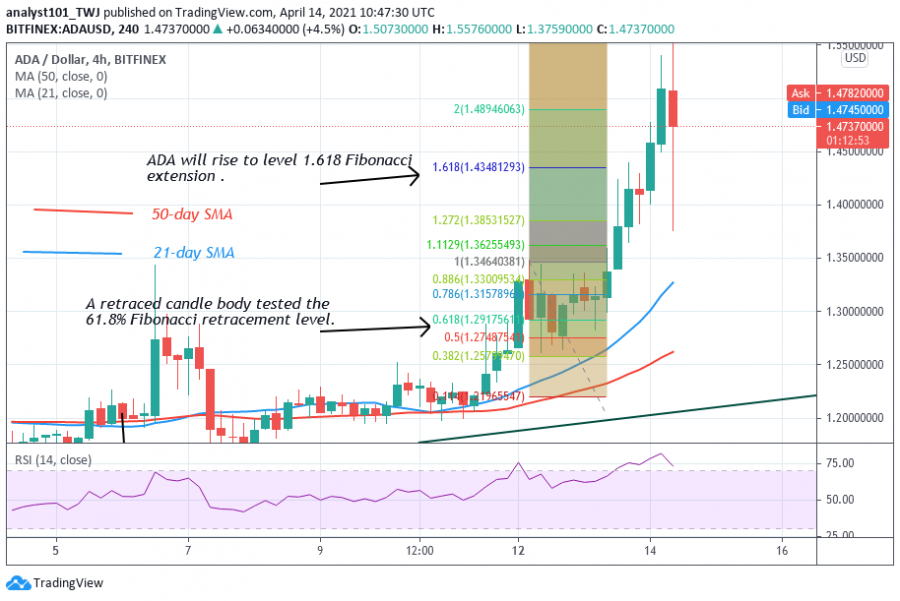
Cardano has resumed a fresh uptrend despite the sudden fall. The market is rising to revisit the previous highs. Meanwhile, on April 12, a retraced candle body tested the 61.8% Fibonacci retracement level. This retracement implies ADA will rise to level 1.618 Fibonacci extensions or the high of $1.43. From the price action, the market has risen past the Fibonacci level. More upside is likely.

Disclaimer. This analysis and forecast are the personal opinions of the author and not a recommendation to buy or sell cryptocurrency and should not be viewed as an endorsement by CoinIdol. Readers should do their own research before investing funds.
Price
News
Price
Price
News

(0 comments)