Cardano Is On The Rise; Price Aiming For $0.47
Updated: Sep 28, 2024 at 22:56

The price of Cardano (ADA) has regained bullish momentum after breaking above the moving average lines on the daily chart.
ADA price Long-term forecast: bullish
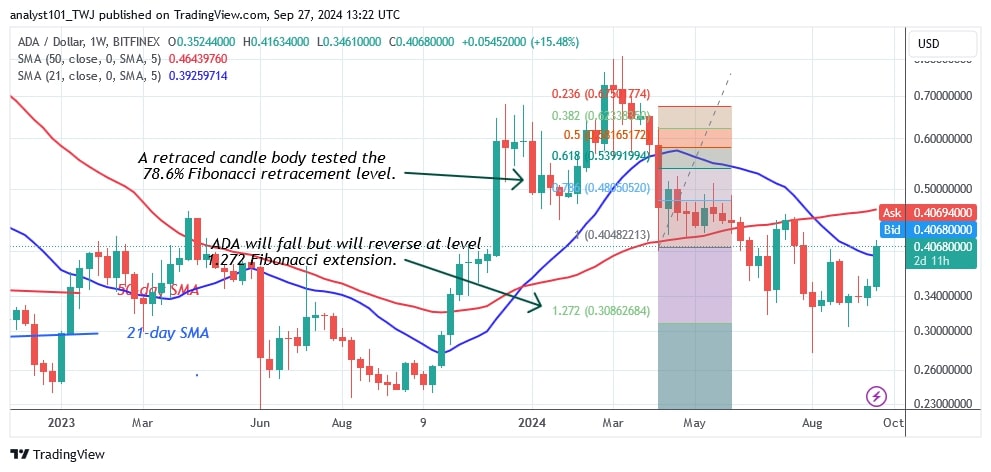
On the weekly chart, the bulls have broken above the 21-day SMA resistance. This means that the altcoin will be trapped between the 21-day SMA support and the 50-day SMA resistance. According to price analysis by Coinidol.com, Cardano will exit the downtrend zone if it breaks above the 50-day SMA resistance level and rises to a high of $0.50.
However, if the bulls fail to break above the 50-day SMA, Cardano will continue to trade in a range between the moving average lines. ADA is currently at $0.40.
Cardano indicator analysis
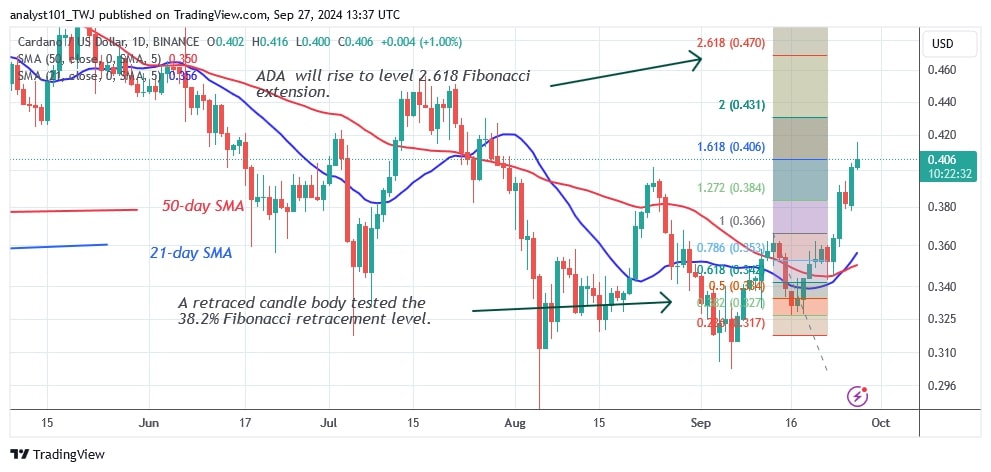
Cardano is in an uptrend after breaking above the 21-day SMA barrier. The uptrend is expected to continue to the upper end of the 50-day SMA. The altcoin will gain value when the price bars move above the moving average lines. The moving average lines on the daily chart have formed a bullish crossover.
Technical Indicators
Key Resistance Zones: $0.80, $0.85, and $0.90
Key Support Zones: $0.50, $0.45, and $0.40

What is the next step for Cardano?
Cardano is in an uptrend after breaking above the moving average lines on the daily chart.
On September 13, a retraced candlestick body approached the 38.2% Fibonacci retracement line. The retracement suggests that ADA will rise to the 2.618 Fibonacci extension or $0.47.

Disclaimer. This analysis and forecast are the personal opinions of the author. They are not a recommendation to buy or sell cryptocurrency and should not be viewed as an endorsement by CoinIdol.com. Readers should do their research before investing in funds.
News
Price
News
Price
Price

(0 comments)