Bitcoin Revisited Previous Low At $21,500 As Sellers Threaten To Short
Updated: Mar 09, 2023 at 13:21

Bitcoin (BTC) price has fallen three times and is nearing its previous low of $21,500.
Bitcoin price long-term forecast: bearish
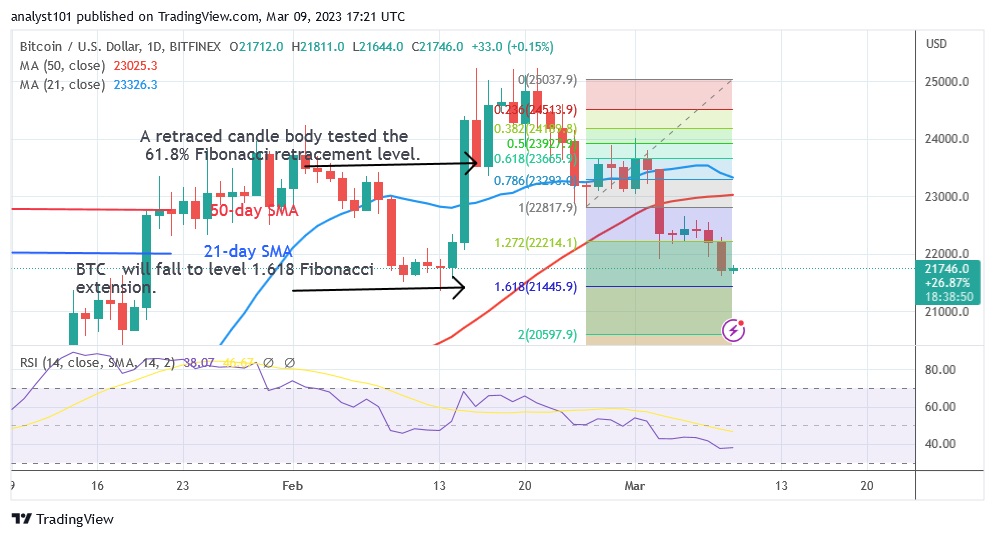
The previous low is the historical price level of February 10. This current support level has held since the price moved on January 20. The current support will be tested for the third time today. If the current support holds, Bitcoin will regain its bullish momentum. Bitcoin will reach previous highs of $23,000 and $24,000. The price levels of $22,500 and $23,500 will likely provide resistance to the upside. If the current support of $21,500 is breached, Bitcoin will fall even further. The cryptocurrency will fall to the psychological level of $20,000 before recovering. The price indicator predicted a similar outcome. After a price decline on February 25, Bitcoin took an upward correction and a candlestick tested the 61.8% Fibonacci retracement level. The correction is expected to cause BTC to fall to the Fibonacci extension level of $1.618, or $21,445.90.
Bitcoin indicator display
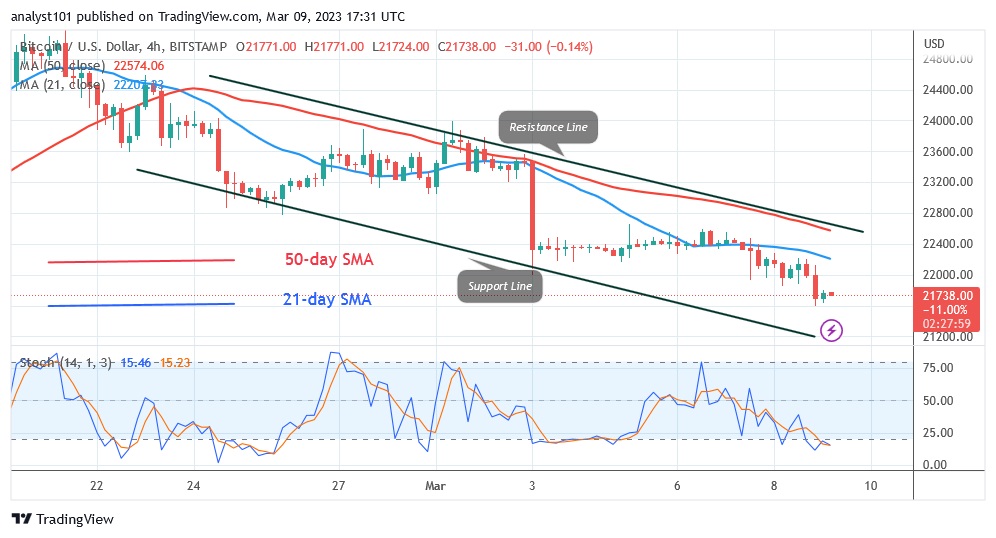
As Bitcoin reaches the 37 level of the Relative Strength Index, it is approaching the oversold zone. The bearish momentum is fading as buyers emerge in the oversold area of the market. The current decline is due to the BTC price bars being below the moving average lines. The value of the cryptocurrency has fallen into the oversold area of the market. This indicates that Bitcoin is below the daily stochastic value of 20.

Technical indicators:
Key Resistance Levels - $30,000 and $35,000
Key Support Levels - $20,000 and $15,000
What is the next direction for BTC/USD?
Bitcoin has retested its current support level of $21,500. At the time of writing, Bitcoin had reached a low of $21,636. The current price level is critical in determining future price levels. The market has reached oversold territory, indicating bearish exhaustion.

Disclaimer. This analysis and forecast are the personal opinions of the author and are not a recommendation to buy or sell cryptocurrency and should not be viewed as an endorsement by CoinIdol. Readers should do their research before investing in funds.
Price
Price
Price
Price
Politics

(0 comments)