Bitcoin Fluctuates As Traders Disagree On Market Direction
Updated: Mar 06, 2023 at 11:56

Bitcoin (BTC) price is already trading below the moving average lines.
Bitcoin price long-term forecast: bearish
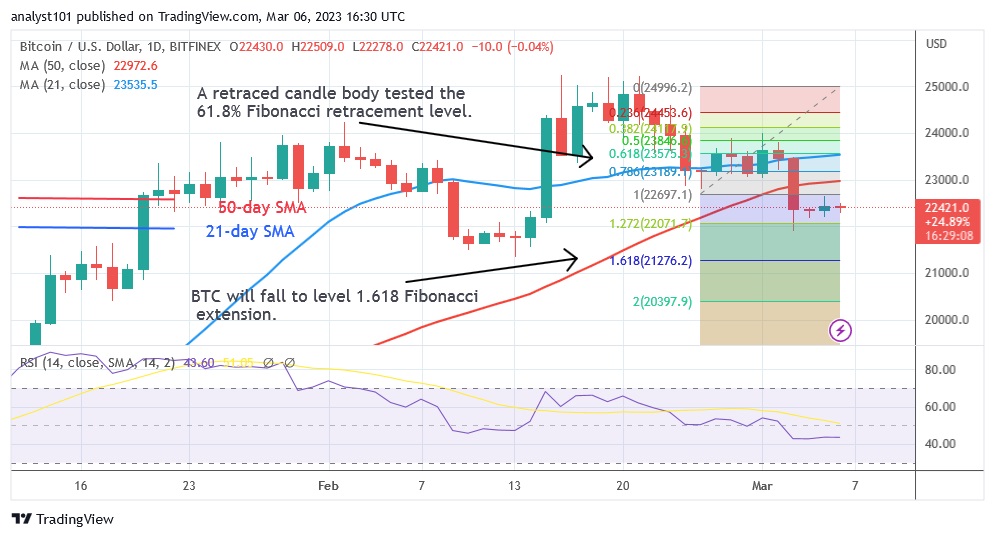
After the price decline on March 3, the largest cryptocurrency asset has consolidated above the $22,000 support level. The price action over the past three months has been characterized by indecisive candles with small bodies known as doji. These candlesticks indicate that buyers and sellers disagree on the direction of the market. As a result, there have been minor fluctuations in the bitcoin price. However, according to the price indicator, Bitcoin will continue to fall. On February 25, the downtrend was reversed and the candlestick tested the 61.8% Fibonacci retracement level. The correction implies that Bitcoin will continue to fall to the 1.618 Fibonacci extension level or $21,276.20. At the time of writing, Bitcoin was trading at $22,408.
Bitcoin indicator display
The RSI is unchanged as the cryptocurrency consolidates above the $22,000 support level. For the period 14, Bitcoin is at level 49 of the Relative Strength Index. If the price bars remain below the moving average lines, the Bitcoin price will continue to fall. Bitcoin is losing below the daily Stochastic level of 50. The bearish momentum has slowed down.

Technical indicators:
Key resistance levels - $30,000 and $35,000
Key support levels - $20,000 and $15,000
What is the next direction for BTC/USD?
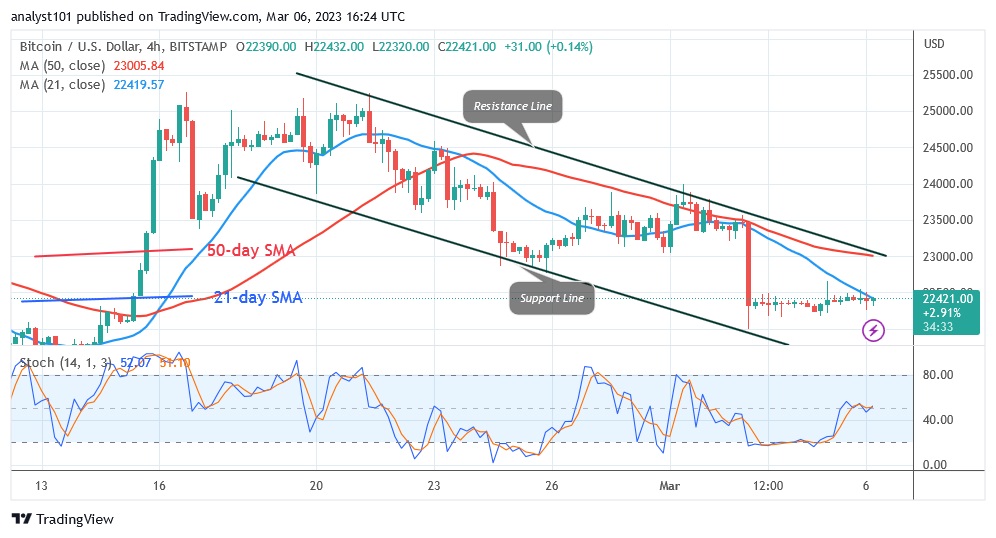
Bitcoin is consolidating above the current support on the 4-hour chart. The price action is strongly dominated by doji candlesticks. The price action has also stalled due to the rejection of the 21-day line SMA. The BTC price is subject to choppy price action and is trading marginally.

Disclaimer. This analysis and forecast are the personal opinions of the author and are not a recommendation to buy or sell cryptocurrency and should not be viewed as an endorsement by CoinIdol. Readers should do their research before investing in funds.
Price
News
Price
News

(0 comments)