Bitcoin Cash Price at a Stalemate, Fluctuates Between $510 and $550

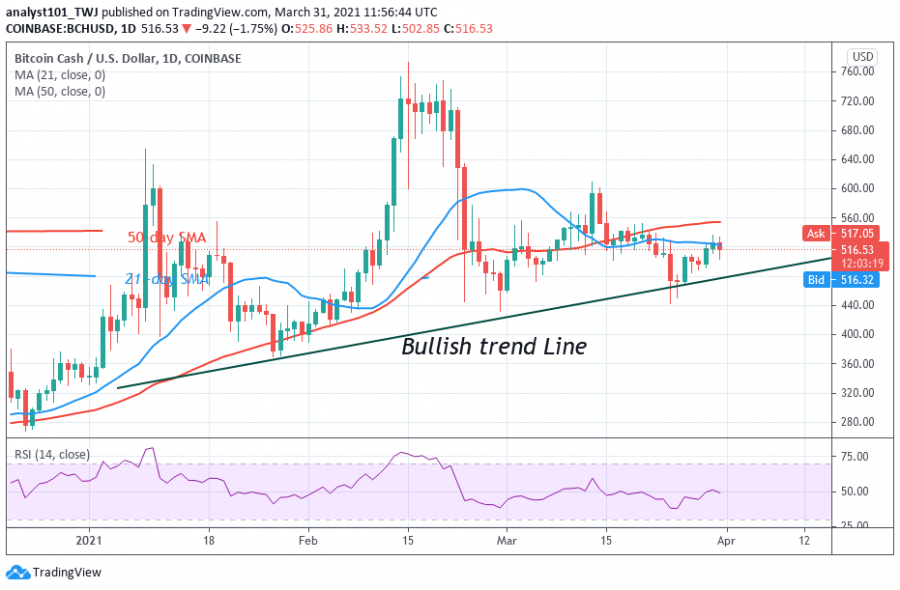
Bitcoin Cash price is falling after retesting the high of $536. BCH fell to the low of $502 and resumed upward. Incidentally, BCH/USD has been range-bound between $510 and $550 since the March 15 breakdown.
Buyers have not been opportune to break the $550 resistance level for the past two weeks. However, the bears broke the lower price level at $510 as price fell to $442 low on March 24.
Immediately, the bulls bought the dips as the altcoin returned to the range-bound zone. One major factor for the range-bound movement is that the market is characterized by small body indecisive candlesticks called Doji and Spinning tops. These candlesticks describe that buyers and sellers are undecided about the direction of the market. The altcoin is trading at $515.92 in the range-bound zone.
Bitcoin Cash indicator reading
The altcoin price is below the 21-day and 50-day SMAs which indicates that price is in the bearish trend zone. BCH is at level 51 of the Relative Strength Index period 14. It indicates that there is a balance between supply and demand. The 21-day and 50-day SMAs are sloping upward indicating the previous uptrend.

Technical indicators:
Major Resistance Levels – $750 and $800
Major Support Levels – $450 and $400
What is the next move for Bitcoin Cash?
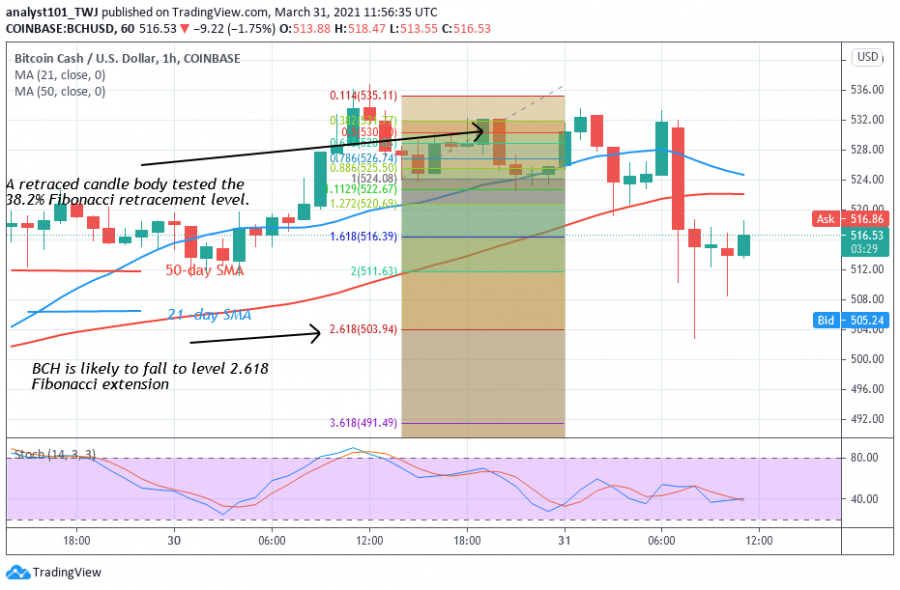
BCH/USD is range-bound between $510 and $550. The price movement has been confined within this range. On March 30 downtrend, BCH fell to $523. The retraced candle body tested the 38.2% Fibonacci retracement level. The retracement indicates that BCH will fall to level 2.618 Fibonacci extensions or the low of $503.94. Today, BCH fell to $504 support and pulled back to resume a range-bound movement.

Disclaimer. This analysis and forecast are the personal opinions of the author that are not a recommendation to buy or sell cryptocurrency and should not be viewed as an endorsement by Coin Idol. Readers should do their own research before investing funds.
Price
Price
Price
Price
Price

(0 comments)