Bitcoin Cash Fluctuates Between $445 and $560 as Bulls and Bears Reach Equilibrium
Updated: Mar 03, 2021 at 15:03

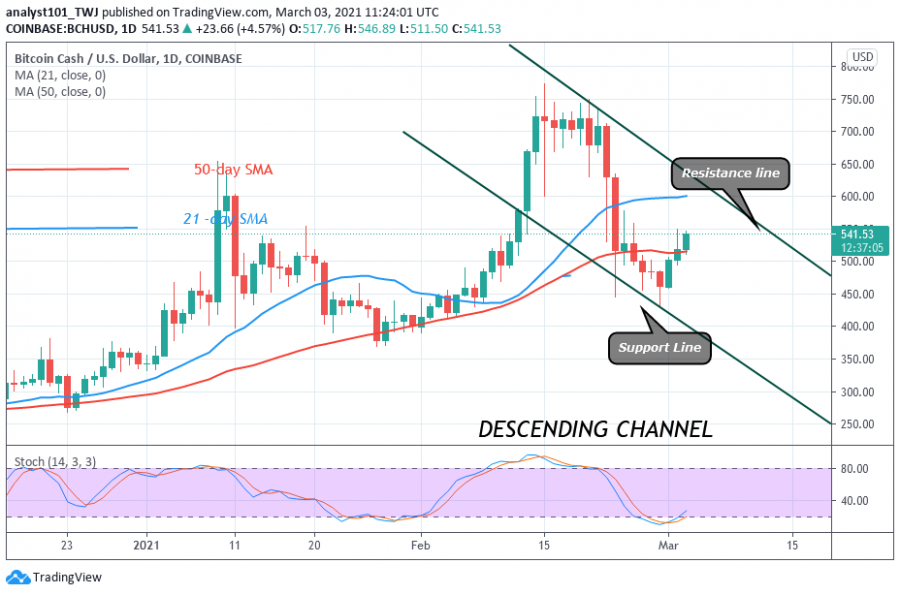
Since February 23 breakdown, Bitcoin Cash has been confined between $445 and $560. For the past two days, BCH has been in an upward movement. Today, BCH traded and was repelled at the $560 upper price range.
Buyers could not sustain the price above the upper price range. BCH is likely to continue with the range-bound movement. In other words, the selling pressure will resume as price revisits the previous low. On the downside, if the bears revisit the previous low and break it, the altcoin will further decline to $370 low. Nonetheless, if the bullish momentum resumes and the price breaks above the $560 resistance, the BCH price will rise to retest the $654 resistance. The BCH/USD is trading at $534.13 at the time of writing.
Bitcoin Cash indicator reading
As the market continues its rise, the price has broken the 21-day SMA. A break above the 21-day and 50-day SMAs will propel BCH to rise. Presently, BCH is above the 25% range of the daily stochastic. It indicates that the market has resumed bullish momentum.

Technical indicators:
Major Resistance Levels – $750 and $800
Major Support Levels – $450 and $400
What is the next move for Bitcoin Cash?
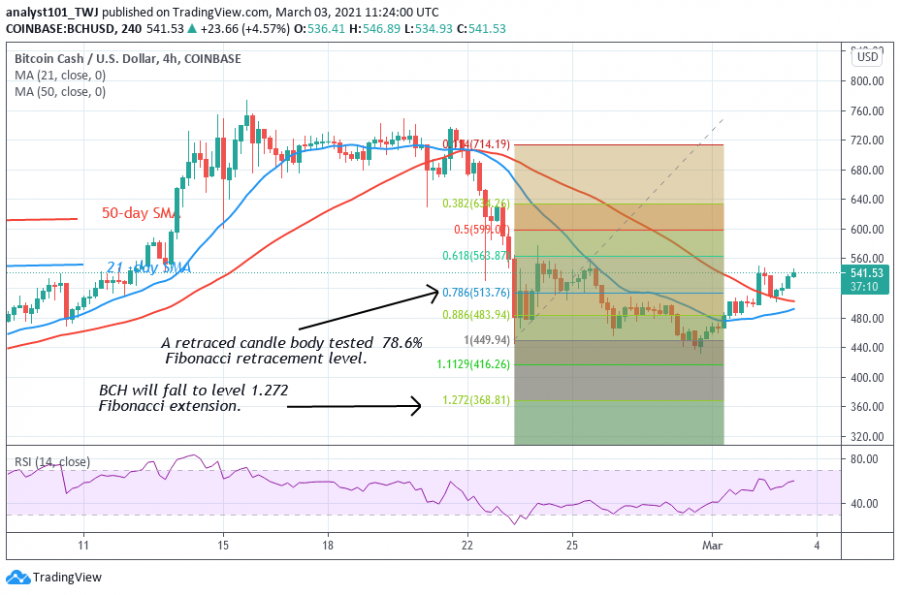
BCH is not trending but it is fluctuating between $445 and $560. The Fibonacci tool has indicated a further downward movement. On February 23 downtrend; the retraced candle body tested the 78.6% Fibonacci retracement level. The retracement indicates that BCH is likely to fall to level 1.272 Fibonacci extensions or the low of $368.81. At this price level, the market will reverse to the 78.6 % Fibonacci retracement level where it originated.

Disclaimer. This analysis and forecast are the personal opinions of the author that are not a recommendation to buy or sell cryptocurrency and should not be viewed as an endorsement by Coin Idol. Readers should do their own research before investing funds.
Price
News
Price
Price
News

(0 comments)