Bitcoin Cash Regains Critical Support at $250, Struggles to Break Into Previous Highs

Following the rejection at $271 high on November 2, the coin plunged to $233 low. After an upward correction to the $245 high twice, sellers retested the $233 low but could not break below it.
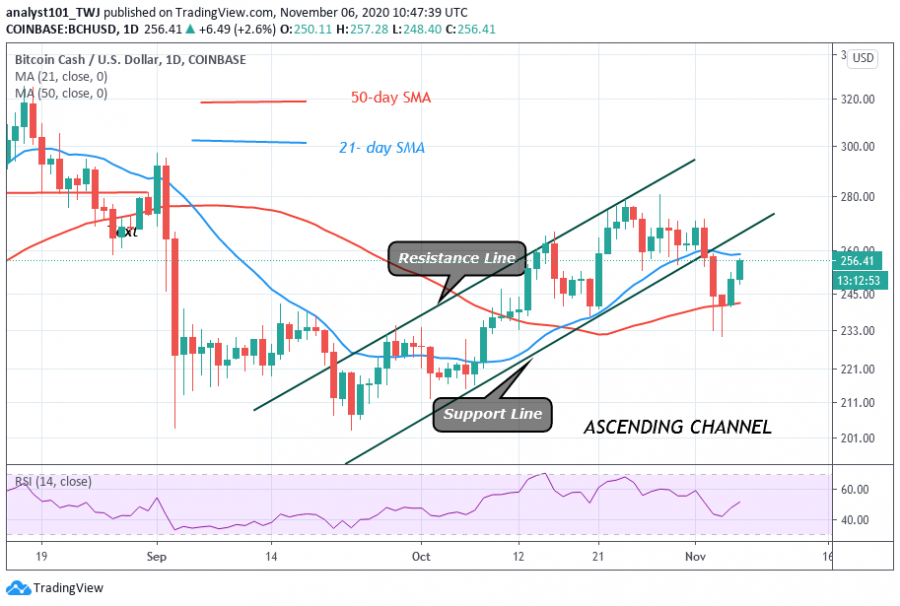
The bulls took advantage as the coin rebounded above the current support. BCH rallied above $250 high as it regained critical support. Nevertheless, the current uptrend is facing resistance at $257. Buyers have been repelled twice at the $257 high.
On the upside, if buyers can push the price above $258 and $271 resistance, a rally above $280 is likely. Alternatively, a strong bounce above the current support will propel the price to break these resistance levels. Nonetheless, if the bulls fail to break this resistance, the coin will return to its previous range bound movement. That is BCH will resume sideways moves between $250 and $280.
Bitcoin Cash indicator reading
BCH price has risen above the 50-day SMA. A break above the SMAs will propel the price to rise. Also, the price bars are below the support line of the ascending channel. The coin will resume upside momentum when it breaks above the support line. BCH is at level 50 of the Relative Strength Index period 14. It indicates that there is a balance between supply and demand.

Key Resistance Zones: $440, $480, $520
Key Support Zones: $200, $160, $120
What is the next move for Bitcoin Cash?
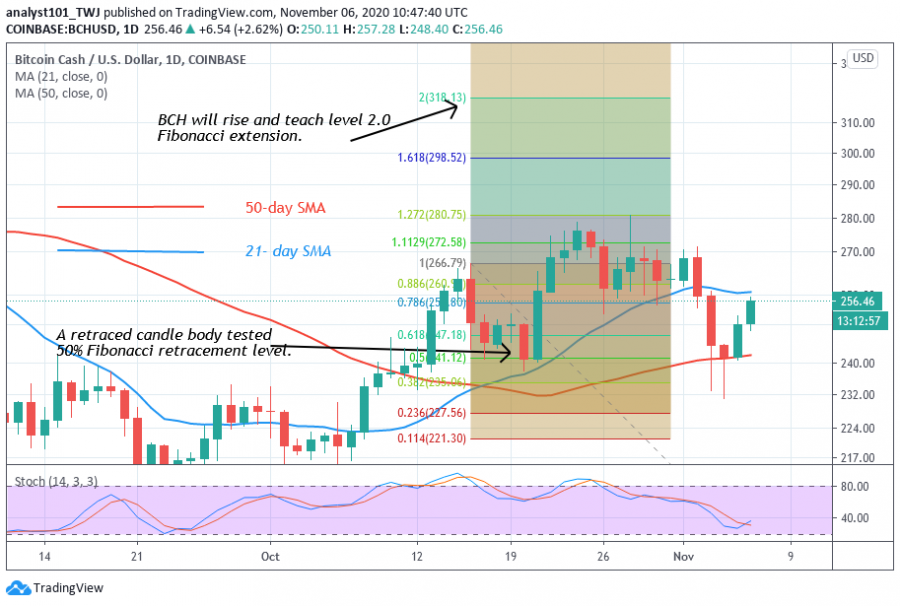
BCH has resumed uptrend above the critical support at $250. On October 20, the retraced candle body tested the 50% Fibonacci retracement level. With this retracement, the market will rise and reach level 2.0 Fibonacci extension. This level is at $318.13 high.

Disclaimer. This analysis and forecast are the personal opinions of the author that are not a recommendation to buy or sell cryptocurrency and should not be viewed as an endorsement by Coin Idol. Readers should do their own research before investing funds.
Price
Price
Price
Price
Price

(0 comments)