Bitcoin Cash Consolidates Above $500, Further Upside Is Imminent
Updated: Mar 12, 2021 at 12:55

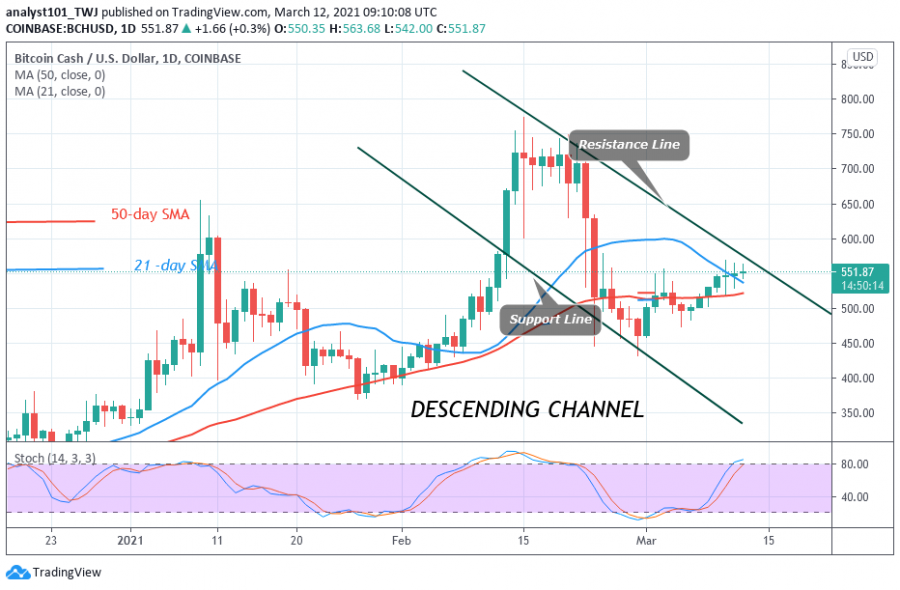
Bitcoin Cash is still fluctuating between $440 and $560 price levels. For the past two days, the price has been consolidating near the resistance zone. The price action is also characterized by small body candlesticks called Doji or Spinning tops which describe the indecision between buyers and sellers.
On the upside, the chances of a breakout are increased when the price consolidates near a resistance level. In the meantime, a breakout is not feasible as the price reaches the overbought region. In the absence of a breakout, the range-bound movement will continue for a few days. Since March 1, the price movement has been confined between $500 and $560. A breakout will compel BCH to rally to $620 and $720 high.
Bitcoin Cash indicator reading
BCH has risen above the 80% range of the daily stochastic. It indicates that the market is in the overbought region. An upward movement of price is unlikely as sellers may emerge in the overbought region. BCH price is above the SMAs which indicates a possible rise in price.

Technical indicators:
Major Resistance Levels – $750 and $800
Major Support Levels – $450 and $400
What is the next move for Bitcoin Cash?
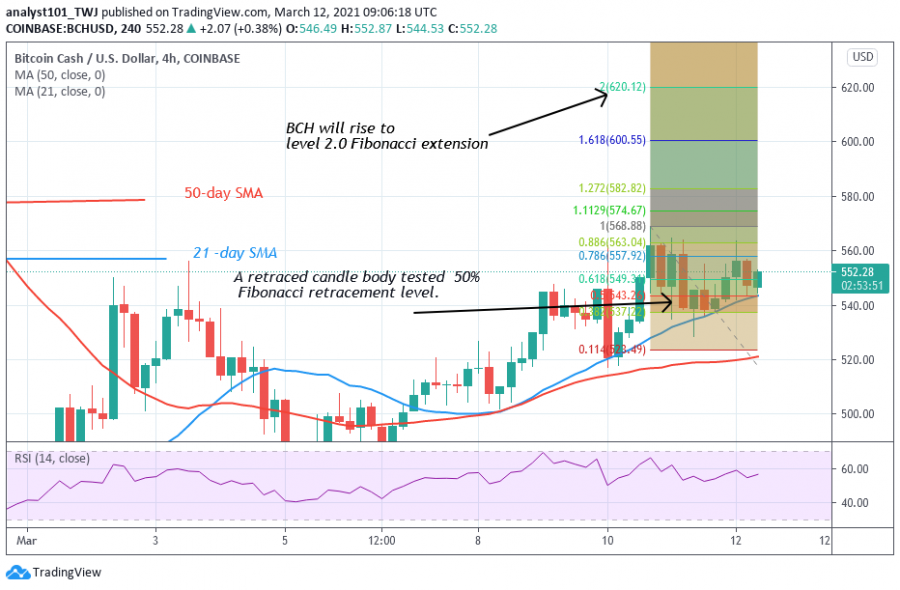
There is a possibility of a breakout as the price consolidates near the resistance zone. On March 10 uptrend; a retraced candle body tested the 50% Fibonacci retracement level. The retracement indicates that BCH is likely to rise to level 2.0 Fibonacci extensions or the high of $620.12. The Fibonacci tool will be attained if the $560 resistance is breached.

Disclaimer. This analysis and forecast are the personal opinions of the author that are not a recommendation to buy or sell cryptocurrency and should not be viewed as an endorsement by Coin Idol. Readers should do their own research before investing funds.
News
Coin expert
Politics
Price
Price

(0 comments)