Binance Coin Reaches Bearish Exhaustion and Holds Above $280 Low
Updated: Mar 09, 2023 at 14:25

Binance Coin (BNB) is in a downtrend after falling below the moving average lines.
Binance Coin price long term forecast: bearish
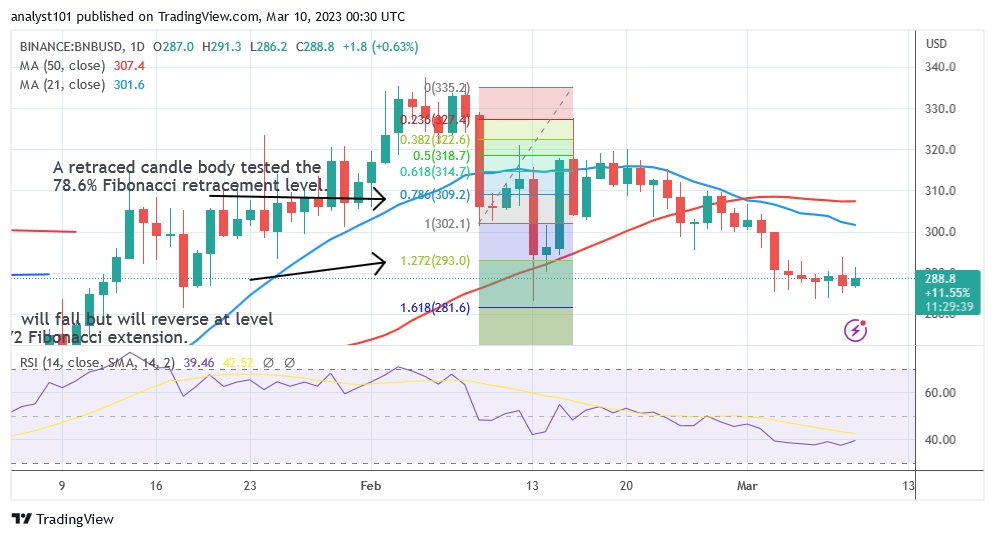
The cryptocurrency asset fell to a low of $283.20 before recovering. With the return to the historical price level of January 18, the altcoin has reached bearish exhaustion. After the price decline on March 3, the resumption of consolidation above the historical price level began. Last week, Binance Coin consolidated above the current support level. The uptrend will continue if the current support holds. Meanwhile, the price indicator indicated that the cryptocurrency could rise. BNB reversed its downtrend on February 9, and a retreating candlestick tested the 78.6% Fibonacci retracement level. The correction predicts that BNB will fall but then reverse at the 1.272 Fibonacci extension or $293.0. Based on price action, BNB appears to be consolidating above the Fibonacci extension. A rise above the current level would signal the end of the current downtrend.
Binance Coin indicator display
BNB is in a downtrend, trading at a Relative Strength Index of 39 for the period 14. BNB is in a downtrend. The price bars of the cryptocurrency are below the moving average lines, indicating a possible decline. The daily stochastic of the altcoin is below the level of 40. The market is trending downwards.

Technical indicators:
Key resistance levels - $600, $650, $700
Key support levels - $300, $250, $200
What is the next direction for BNB/USD?
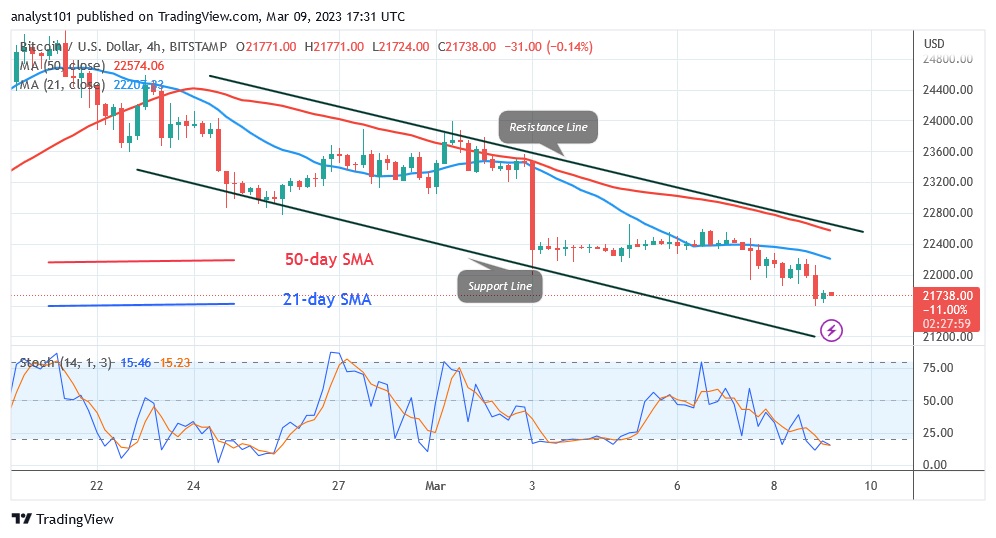
Binance Coin has reached bearish exhaustion and is now trading above $280 support. The altcoin has consolidated above the current support level in anticipation of a possible bounce. BNB is trapped between the moving average lines in the lower time frame. This means that the altcoin will be forced to move in a range for a few days.

Disclaimer. This analysis and forecast are the personal opinions of the author and are not a recommendation to buy or sell cryptocurrency and should not be viewed as an endorsement by CoinIdol. Readers should do their research before investing in funds.
Price
News
Price
Price
Price

(0 comments)