Bitcoin Cash Retests $290 Low and Risks Possible Crash

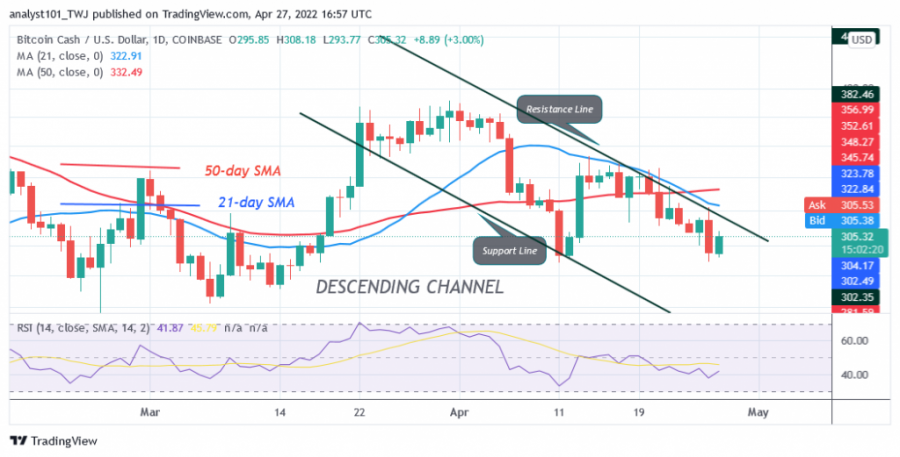
Bitcoin Cash (BCH) price is in a downtrend as the price has broken below the 50-day line SMA. BCH Price was previously trapped between the moving averages. Price's break below the moving averages signals the resumption of the downtrend.
Bitcoin Cash price long-term analysis: bearish
BCH has retraced to the previous low at $290. In the last 48 hours, the current support has held while the altcoin resumes its uptrend.
Today, BCH is trading at $308 at press time. The altcoin is facing rejection at the $308 high, which is the March 10 resistance level. On March 10, the altcoin was rejected when it fell to the low of $278. If the altcoin falls back below the current support at $290, the downtrend will continue. BCH will fall further to $278 or $259.
Bitcoin Cash Indicator Reading
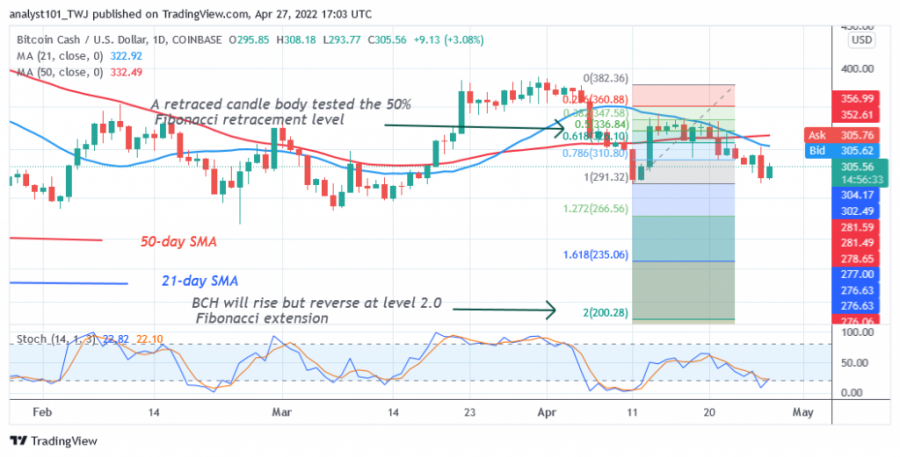
BCH has fallen to the 41 level of the Relative Strength Index for the 14 period. It indicates that BCH has fallen into the downtrend area and is capable of further downward movement. The market may continue to decline as the price bars are below the moving averages. The altcoin has a bearish crossover. That is, the 21-day line SMA crosses below the 50-day line SMA, indicating a sell order. BCH is below the 20% area of the daily stochastic. This means that the altcoin has reached the oversold area.

Technical Indicators:
Major resistance zones: $800, $820, $840
Important support zones: $400, $380, $360
What is the next move for Bitcoin Cash (BCH)?
Bitcoin Cash is in a downtrend as the altcoin falls back to the previous low. There are signs of further downward movement when the altcoin loses the current support. Meanwhile, on April 11, the downtrend; a retracement candlestick tested the 50% Fibonacci retracement level. The retracement suggests that BCH will rise but reverse at the 2.0 Fibonacci extension level or at $200.28.

Disclaimer. This analysis and forecast are the personal opinions of the author and are not a recommendation to buy or sell cryptocurrency and should not be viewed as an endorsement by Coin Idol. Readers should do their own research before investing funds.
Price
Price
News
Price
Price

(0 comments)